




Research checked: 6 November 2026. An Australian wage growth pay review needs more than one percentage. The latest RBA statement discusses annual wage growth of 3.2% overall, 3.1% in the private sector and 2.9% under individual arrangements. Those figures describe broad wage movements, not the rise every worker should receive.
The useful question is which evidence answers your actual pay-review question. Your applicable contract or industrial instrument, comparable roles and changed responsibilities can matter for different reasons. Keep those evidence types separate before deciding what to ask your manager.
Read the date before using the wage number
The RBA’s November 2026 economic conditions chapter, published on 3 November, discusses wage growth over the year to the June quarter 2026. The publication date is fresh; the observation period is earlier.
The three headline rates cover overlapping populations. The total Wage Price Index includes private-sector jobs. Individual arrangements describe a wage-setting method rather than a third, separate sector. Do not add the rates, average them into a new benchmark or treat them as mutually exclusive groups.
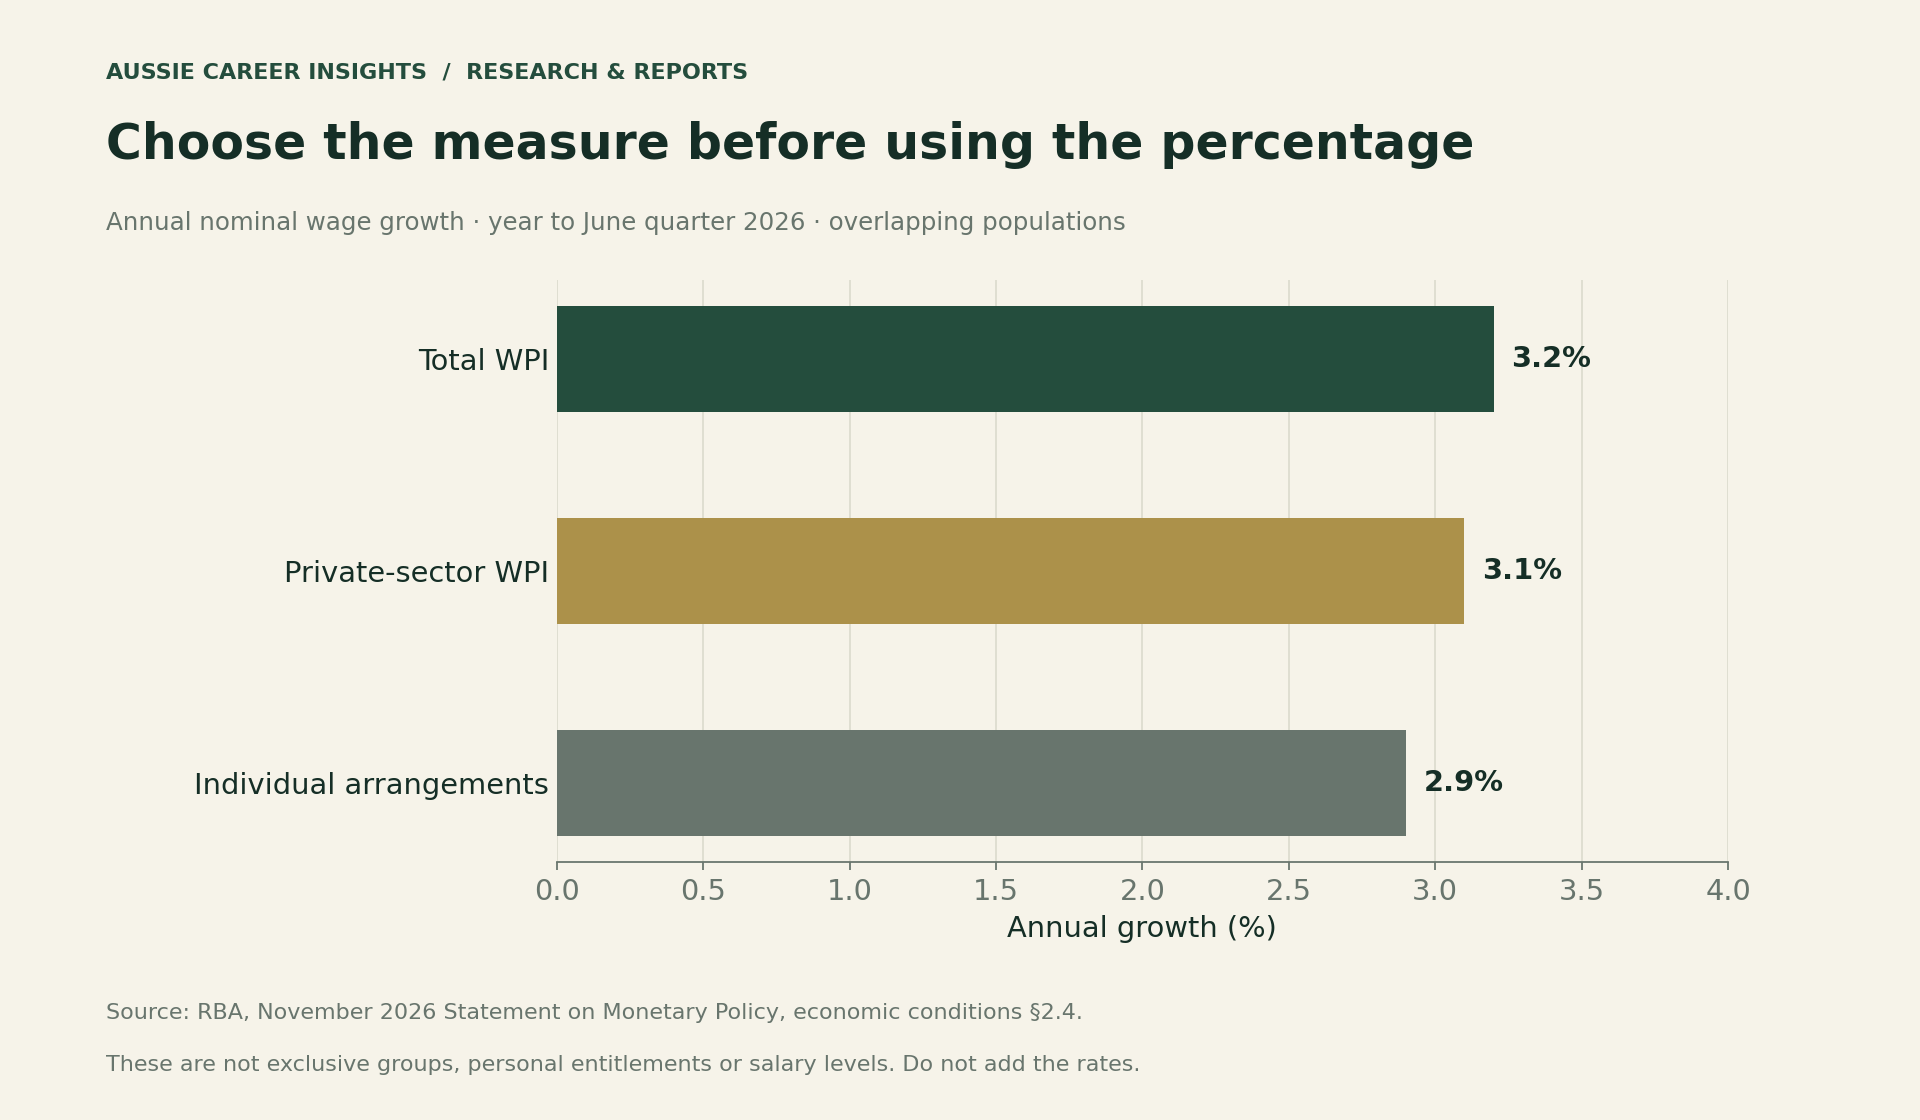
The ABS June 2026 release reports the total and private-sector seasonally adjusted rates. Its reference period is June, and its original release date was 19 August. The next scheduled release is 18 November 2026; check that release before reusing these figures later.
A short trend is context, not a promise
The total seasonally adjusted annual WPI rate moved from 3.5% in March 2025 to 3.2% in June 2026, with movements between those dates. That is a series of year-ended growth rates, rather than a six-quarter cumulative pay rise.
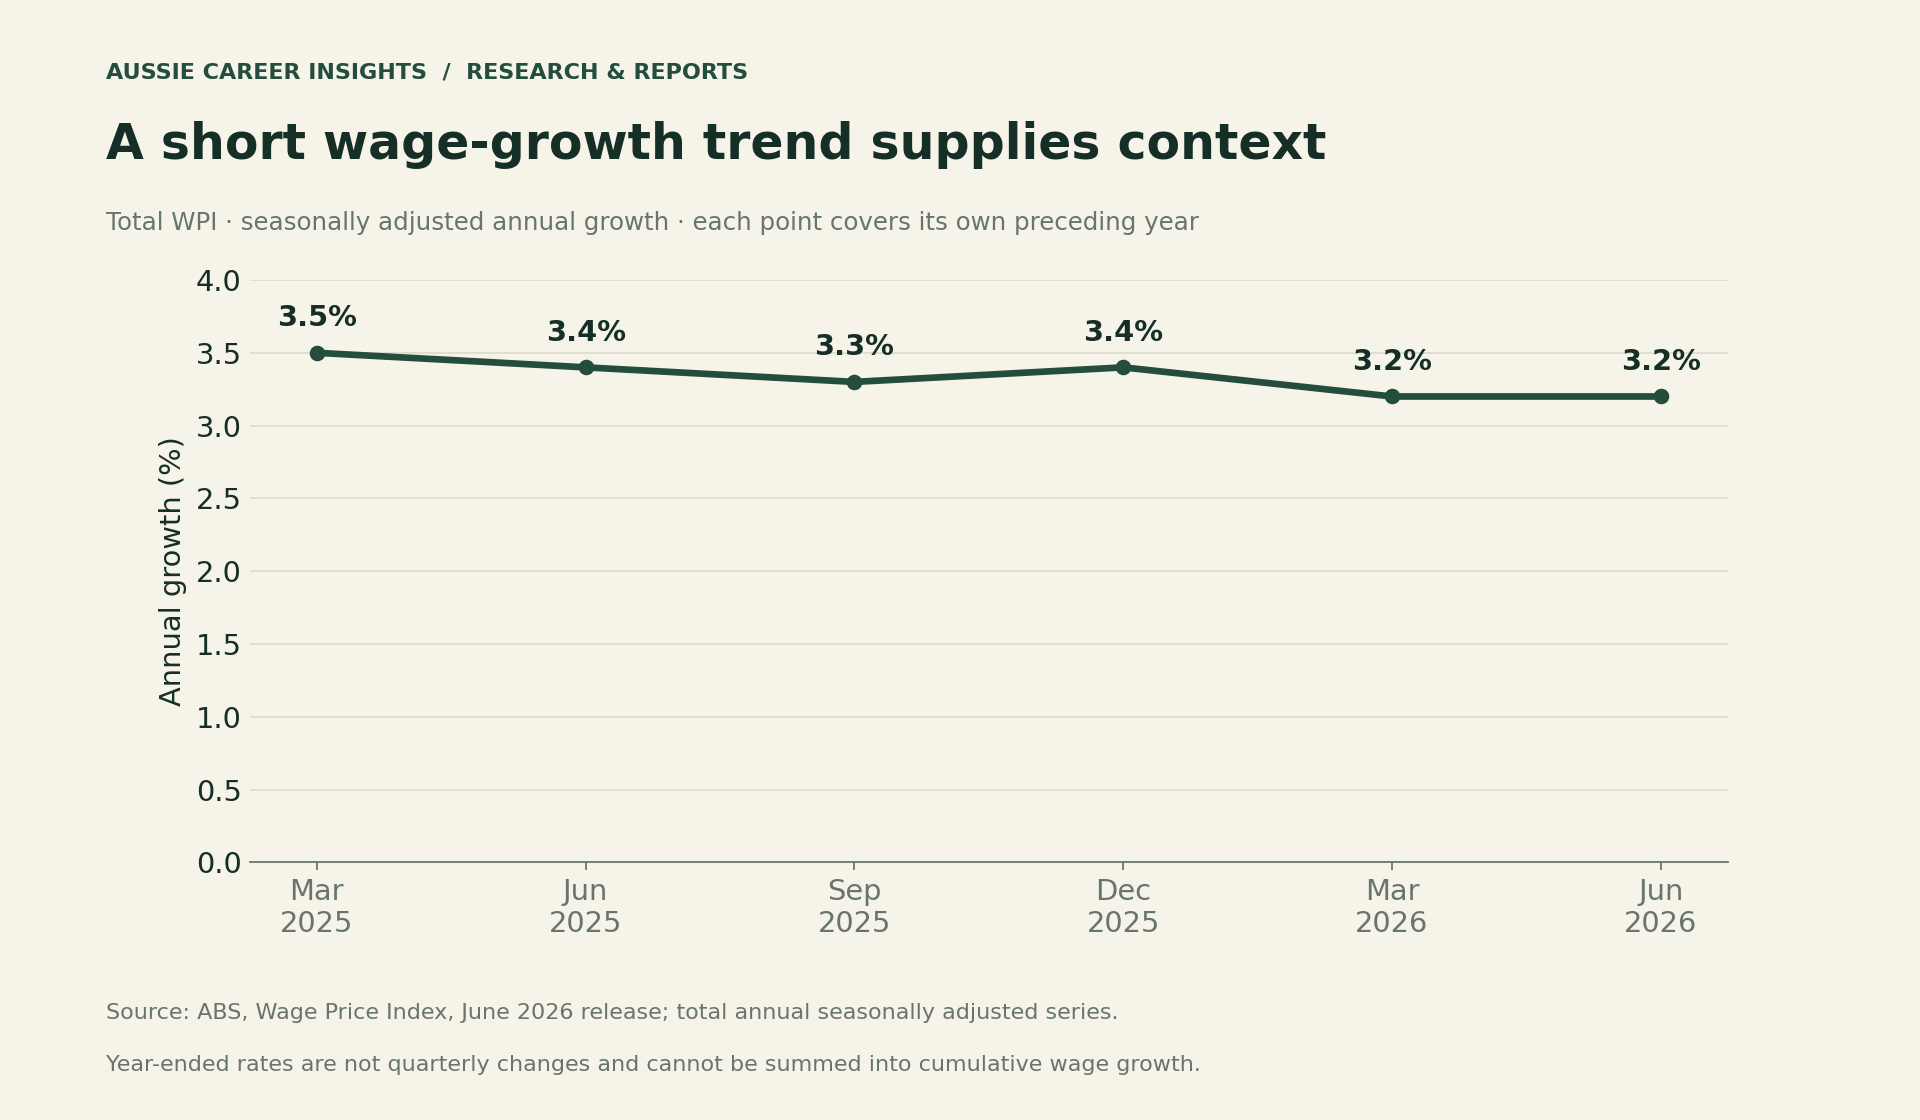
The index helps describe the wider environment. It cannot tell you whether your employer will approve a request, how your occupation is paid locally or what changed in your own role.
What would these rates mean on A$100,000?
For a fictional A$100,000 annual base salary, applying 3.2%, 3.1% or 2.9% produces gross increases of A$3,200, A$3,100 or A$2,900. The calculation is base salary multiplied by the assumed rate divided by 100.
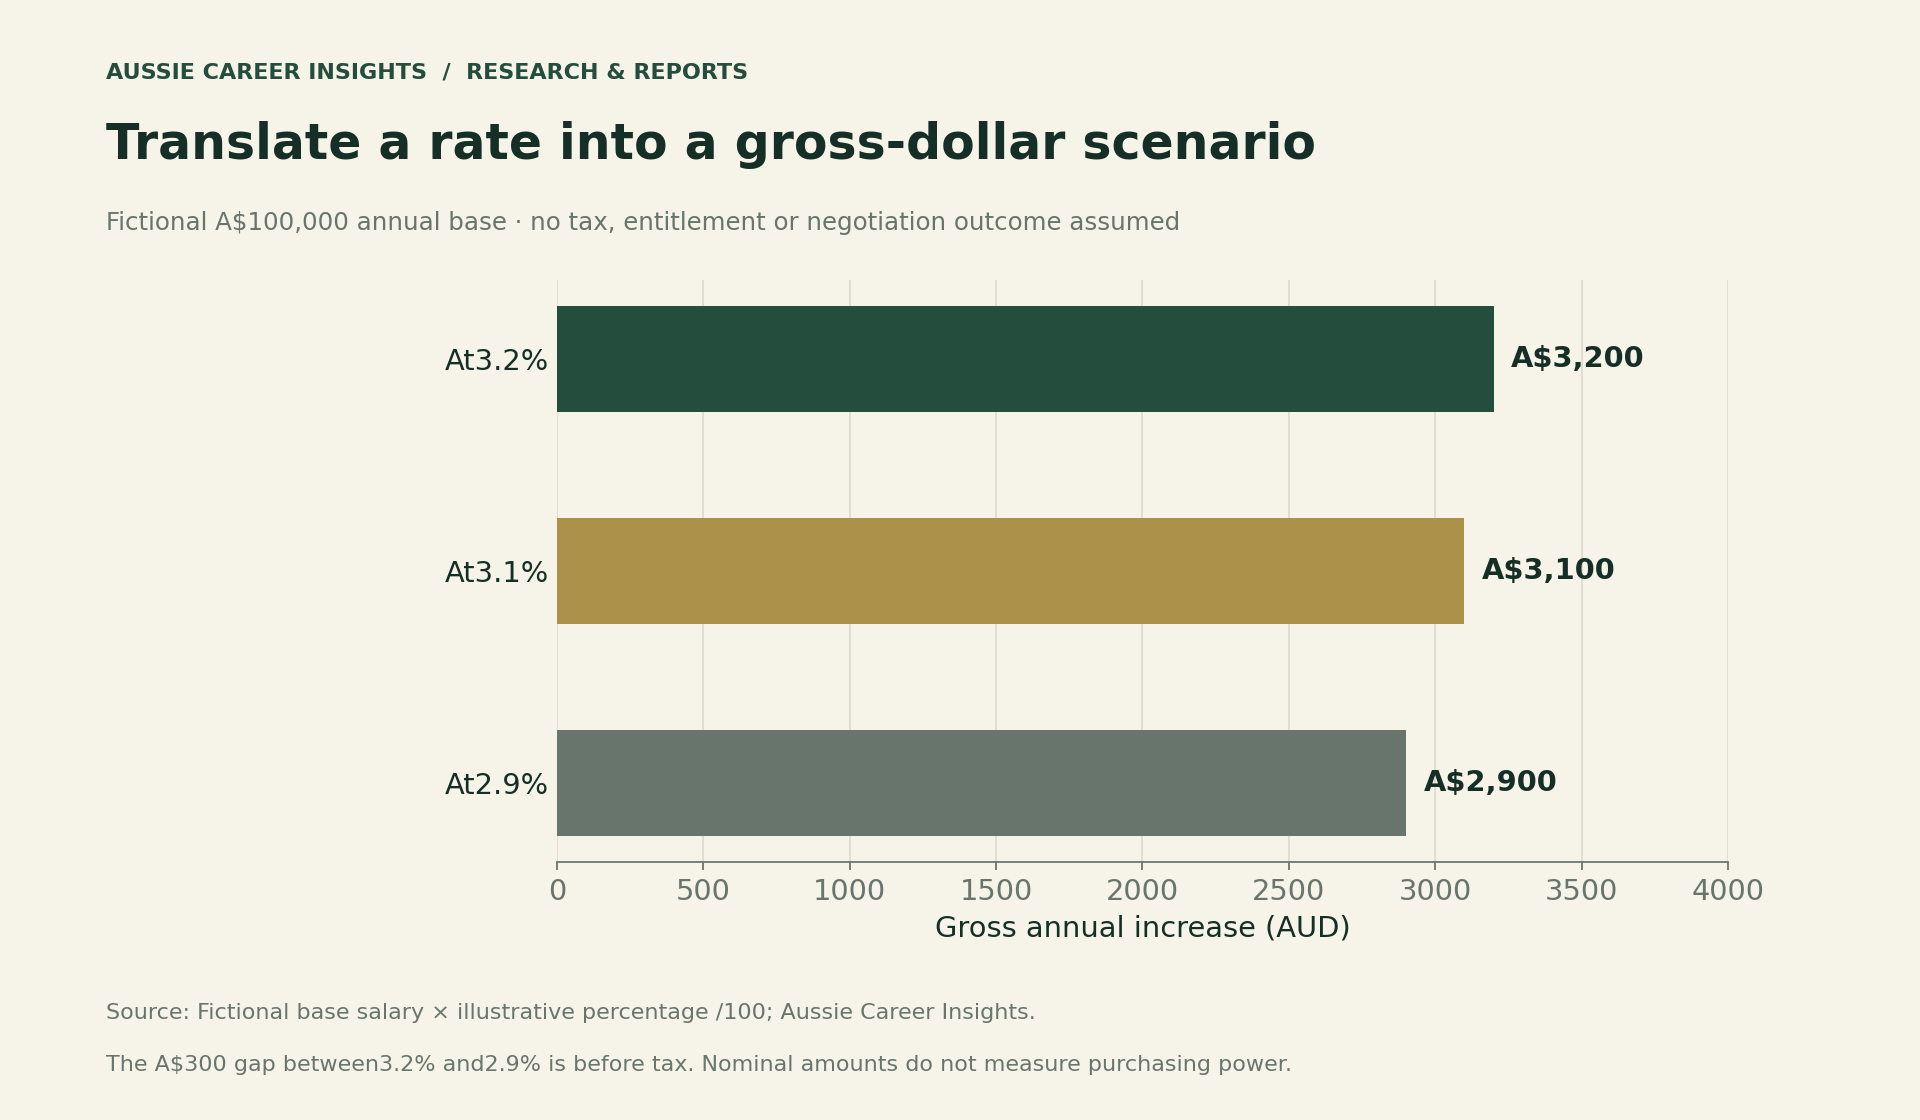
The A$300 gap between the first and third scenarios is before tax. It does not show purchasing power, because these are nominal figures and no personal cost-of-living adjustment has been applied. A household’s spending pattern is also different from a wage index.
Use four kinds of pay-review evidence
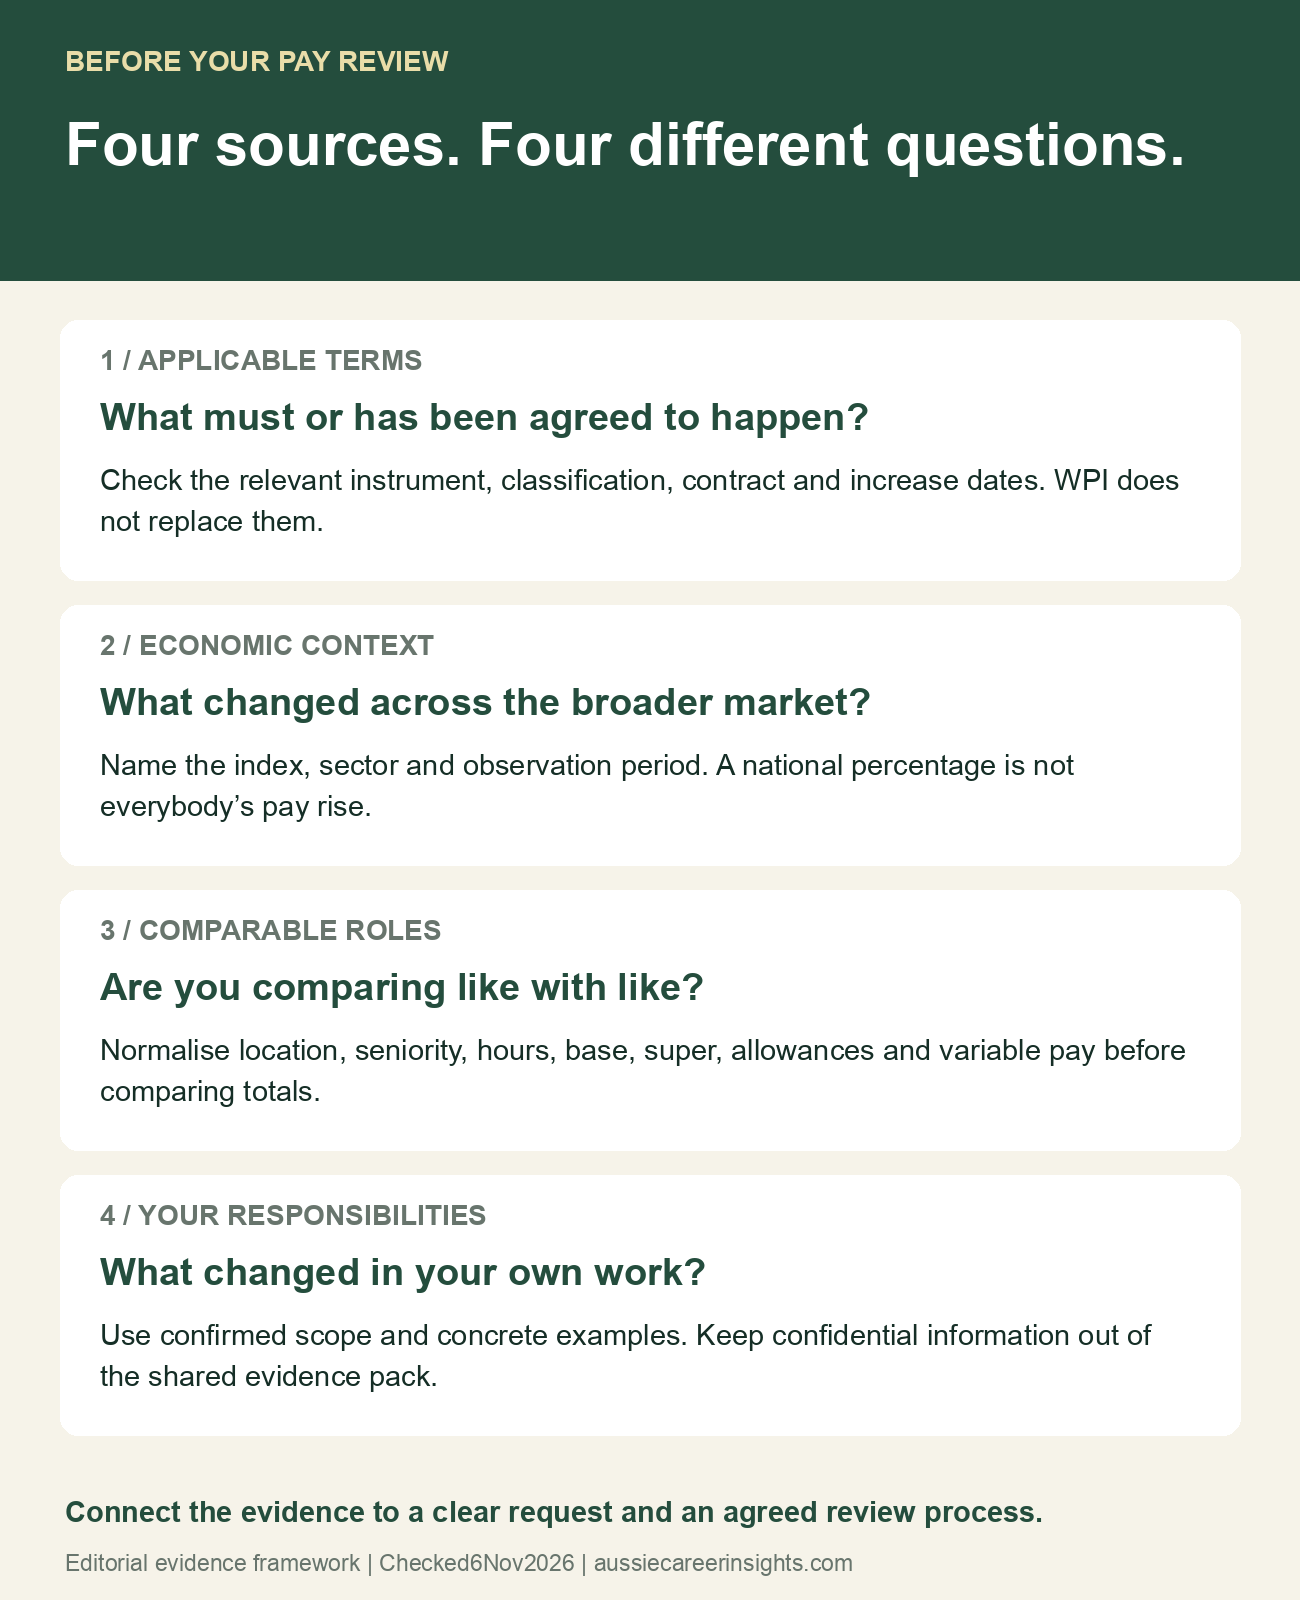
First, check the applicable minimum and agreed terms. That may involve an award, enterprise agreement, contract and the correct classification. Use Fair Work’s pay guidance or qualified advice to resolve coverage questions; the national WPI is not a legal ceiling or a substitute for those terms.
Second, use the broad economic index as dated background. State the series, sector, reference quarter and annual or quarterly basis. Avoid switching between trend, original and seasonally adjusted figures without explaining the difference.
Third, gather comparable role evidence. Record location, hours, seniority, responsibilities, contract type, base salary, superannuation and variable pay. An advertised range is an employer’s advertised range, not proof that every person receives its upper end.
Fourth, document how your own work has changed. Use verifiable examples such as additional responsibilities, scope, qualifications used or sustained delivery. Keep confidential client and colleague information out of any evidence pack you circulate.
Compare hours before annual salaries
A fictional A$100,000 salary spread over 38 hours a week and 52 weeks equals about A$50.61 per scheduled hour. The same annual base over 40 hours equals about A$48.08. These simplified annualised rates are not legal hourly-rate calculations.
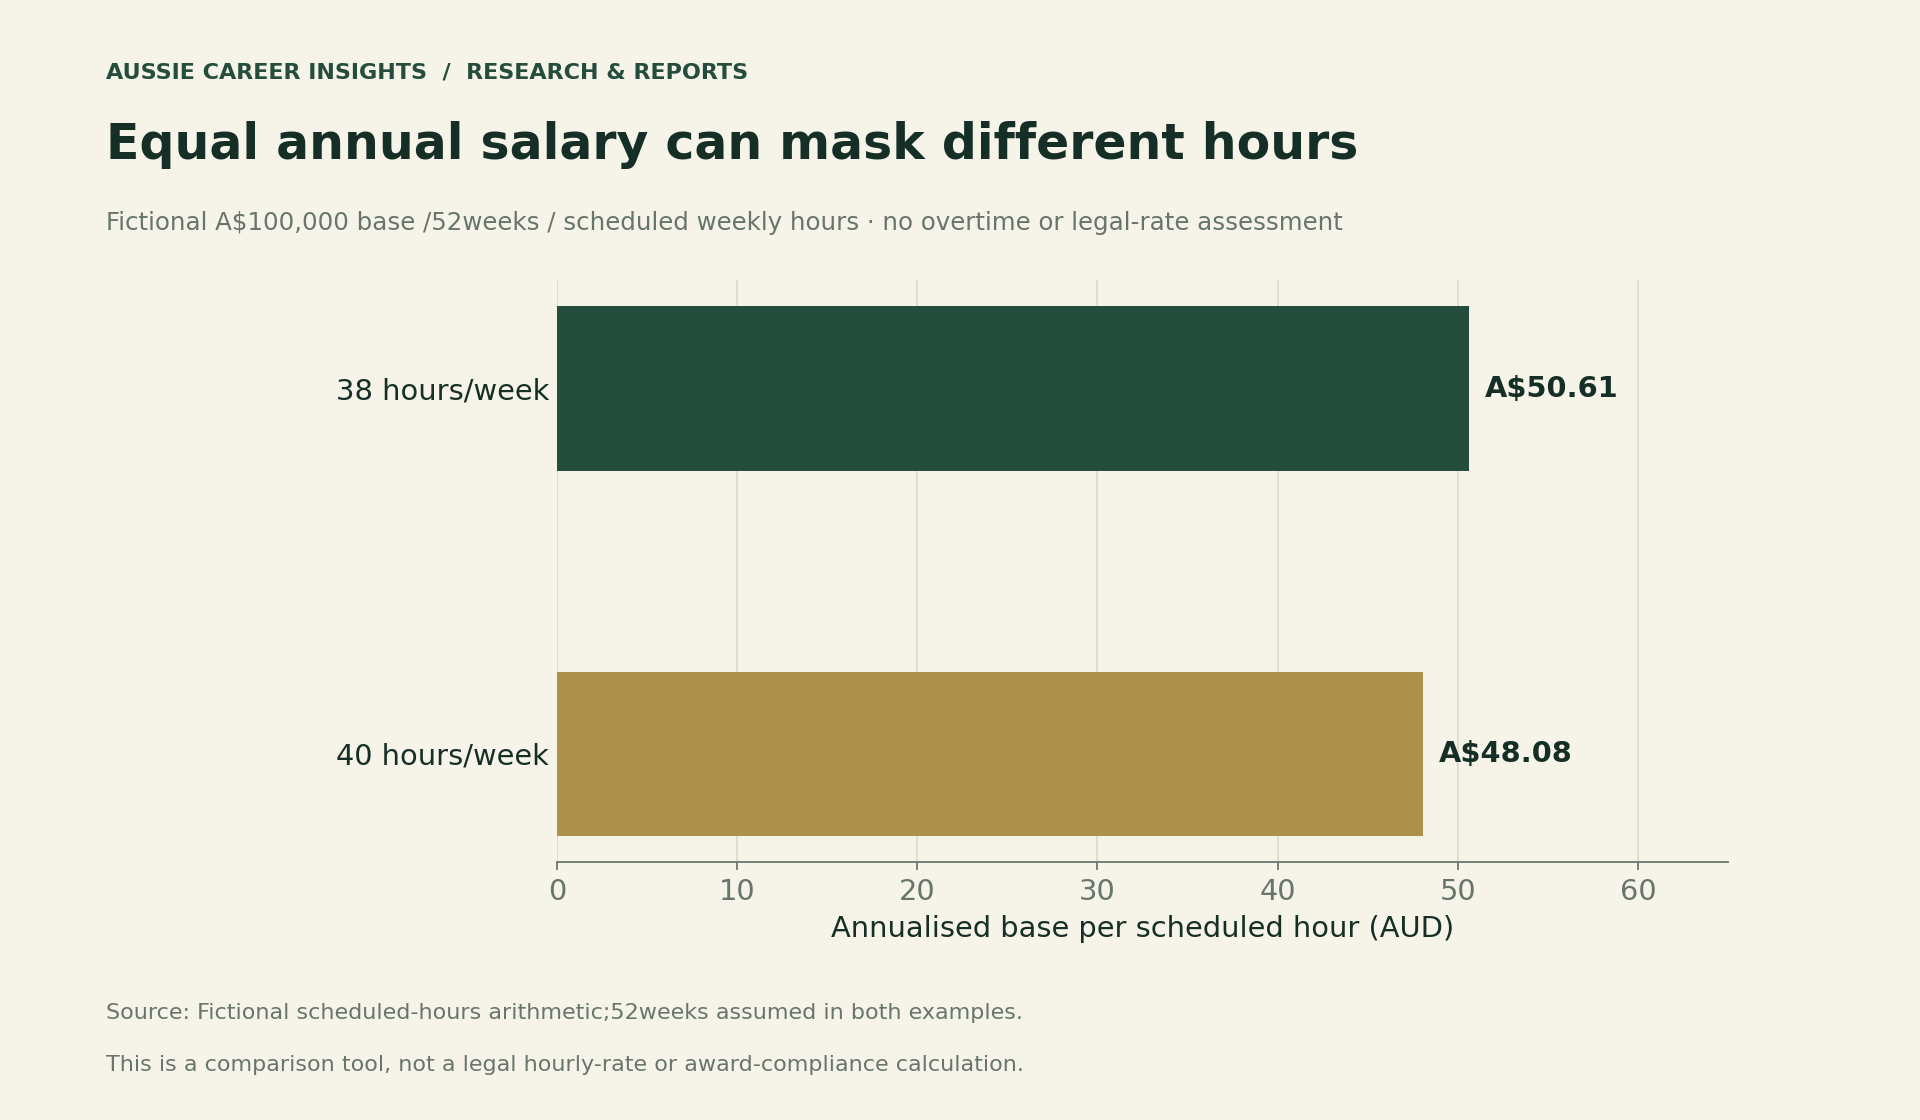
Record expected overtime and availability requirements separately. Do not treat an annualised comparison as evidence that unpaid additional hours are lawful, or use it to assess award compliance without the relevant rules.
Your Personalized Career Strategy
Unlock your potential with tailored career consulting. Get clear, actionable steps designed for your success. Start now!
Get StartedSeparate base salary from a package
A package that includes superannuation is different from base salary plus superannuation. In a fictional example using an assumed 12% employer contribution solely for comparison, A$100,000 base plus A$12,000 contribution gives a A$112,000 package. A A$100,000 inclusive package gives A$89,285.71 base if the whole base attracts that assumed contribution.
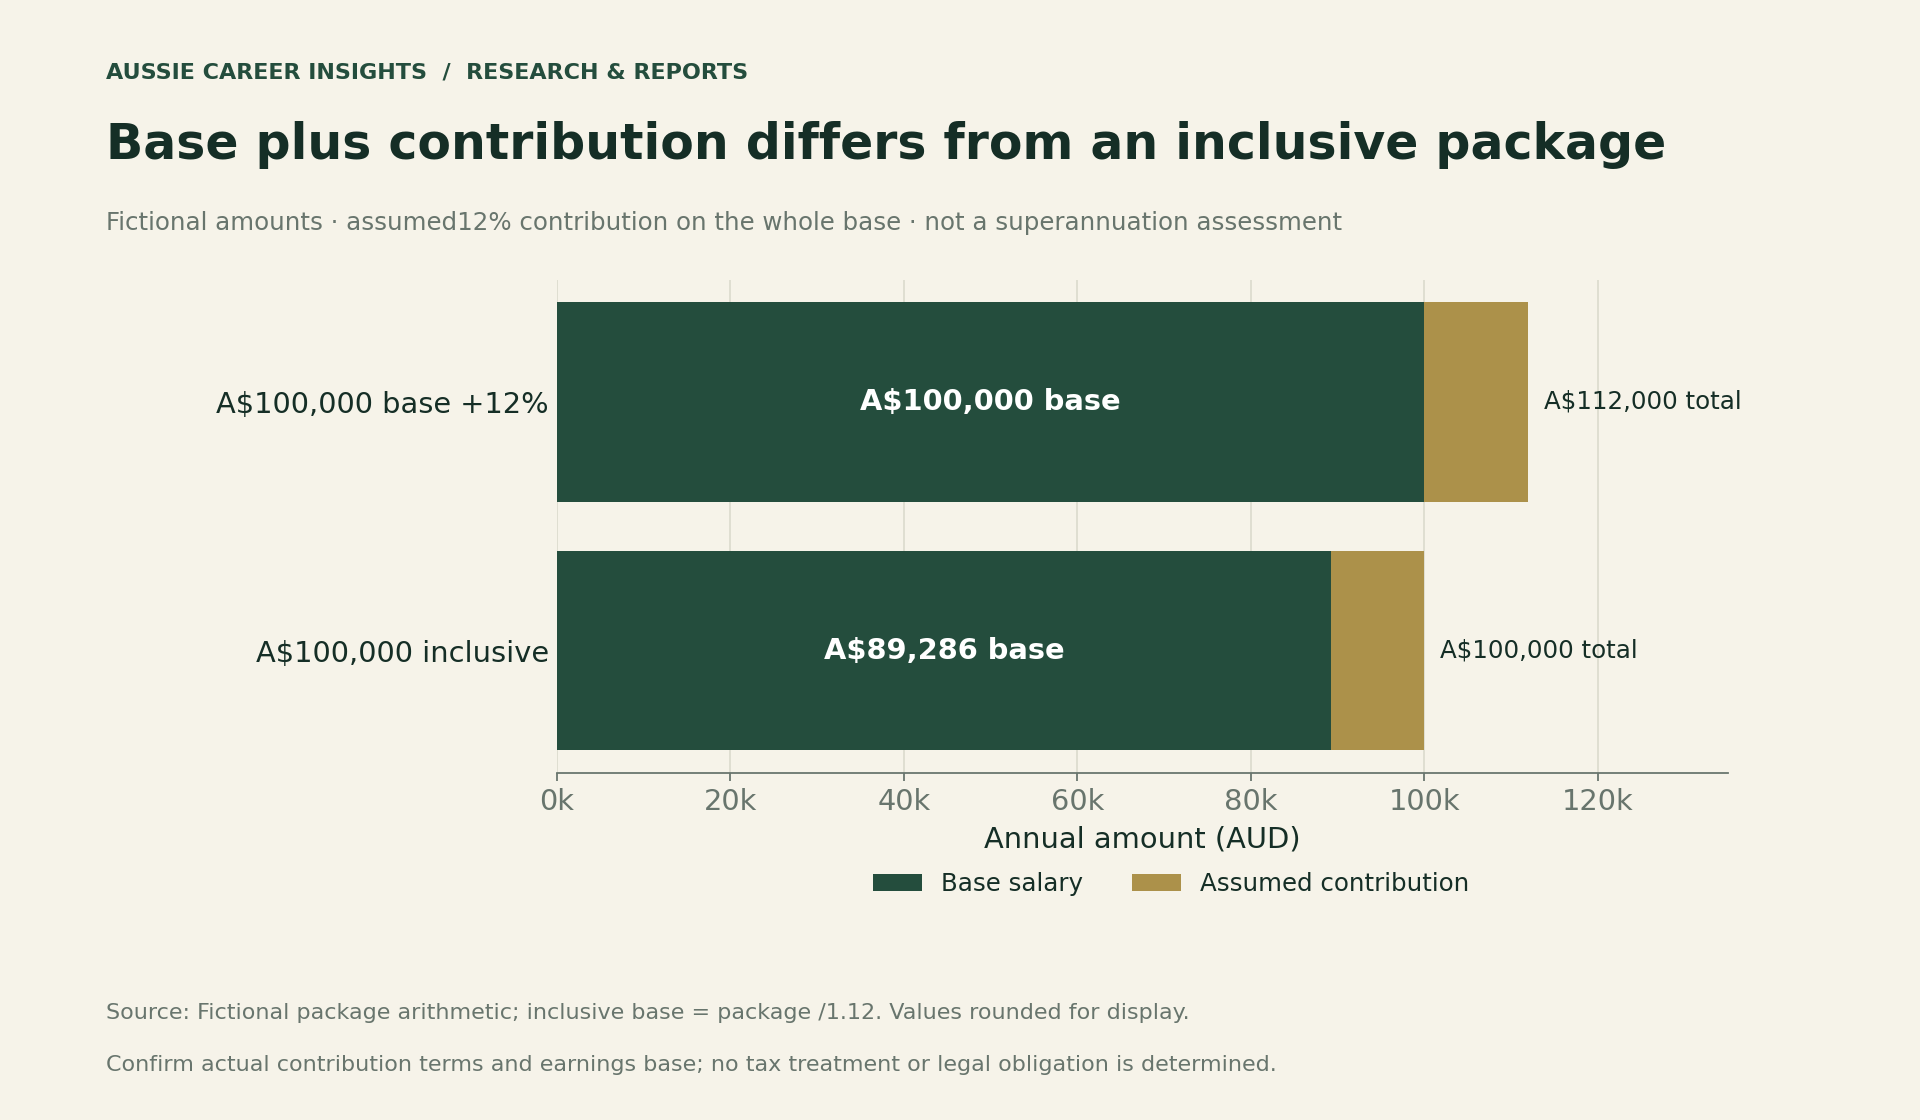
Confirm the actual contribution terms, ordinary-time earnings basis and any relevant limits with payroll or an adviser. Keep discretionary bonuses, commissions and allowances in separate columns instead of quietly treating them as guaranteed base pay.
Build your Australian wage growth pay review pack
Use a one-page comparison before the meeting. State what you currently receive, what evidence you have checked and what change you are requesting. Give each figure a date and a definition so the discussion does not drift between base pay, package and take-home income.
| Evidence | Record | Avoid assuming |
|---|---|---|
| Applicable terms | Instrument, classification, agreed increase date | WPI replaces contractual or legal requirements |
| Economic context | Series, quarter, annual or quarterly rate | Everyone received the published rate |
| Comparable roles | Location, hours, base, super and scope | A different title or larger package is directly comparable |
| Your role | Confirmed responsibilities and examples | Extra duties guarantee a particular percentage |
Ask how the employer evaluates pay, what evidence it needs and when a decision or further review will occur. If the answer involves training, our adult-learning feasibility guide helps you separate promised support from time and cash you must provide yourself.
For a change of employer, use our local job-market comparison alongside role-level evidence. Regional labour-market statistics and wage indexes describe different things; neither replaces a real offer.
Download the data and comparison worksheets
Download the source-linked wage series (CSV) and the fictional salary, hours and package calculations (CSV). The files distinguish observed rates from assumed personal scenarios.
Use the blank like-for-like role worksheet (CSV) and the blank evidence pack (CSV) to organise your own checks. The worksheets stay on your device; do not enter confidential information into public comments or social posts.
Methodology and limitations
We transcribed the three headline rates from the RBA chapter and checked total and private-sector figures against the dated ABS release. The short total-WPI trend uses the ABS seasonally adjusted annual series. The ABS methodology explains that WPI tracks wage-price changes while holding job characteristics constant, rather than measuring changes caused by different hours or responsibilities.
All salary, hours and package examples are fictional arithmetic. We use 52 weeks and the stated hours, without estimating tax, overtime, inflation, legal compliance or a negotiation outcome. Package components are rounded to cents; charts may display whole dollars for legibility. No employer salary survey or personal wage forecast is inferred.
Update note: checked 6 November 2026. Review these benchmarks after the next ABS WPI release and retain the observation dates when citing this article.


