




Comparing local job markets takes more than finding the lowest unemployment rate. The Australian Bureau of Statistics launched its Regional Labour Force publication on 22 October 2026. Its September figures provide useful context for a wider job search. However, they cannot tell you whether moving will secure an offer in your occupation.
Our analysis checks four regions against the original ABS workbook. It shows how unemployment, participation and employment can tell different stories about the same place. Use the five charts and location worksheet below before comparing actual vacancies, household costs and written offers.
What the new regional publication changes
The September 2026 ABS release brings modelled regional estimates into a dedicated publication. The modelling itself predates this release. Its SA4 series extends back to January 2012, while SA3 estimates are expected in November. Do not treat that planned SA3 release as data already available.
These are original estimates. In other words, they retain seasonal effects rather than removing them. A single monthly movement can therefore reflect more than a lasting shift in local demand. Compare consistent periods and definitions before describing a place as improving or deteriorating.
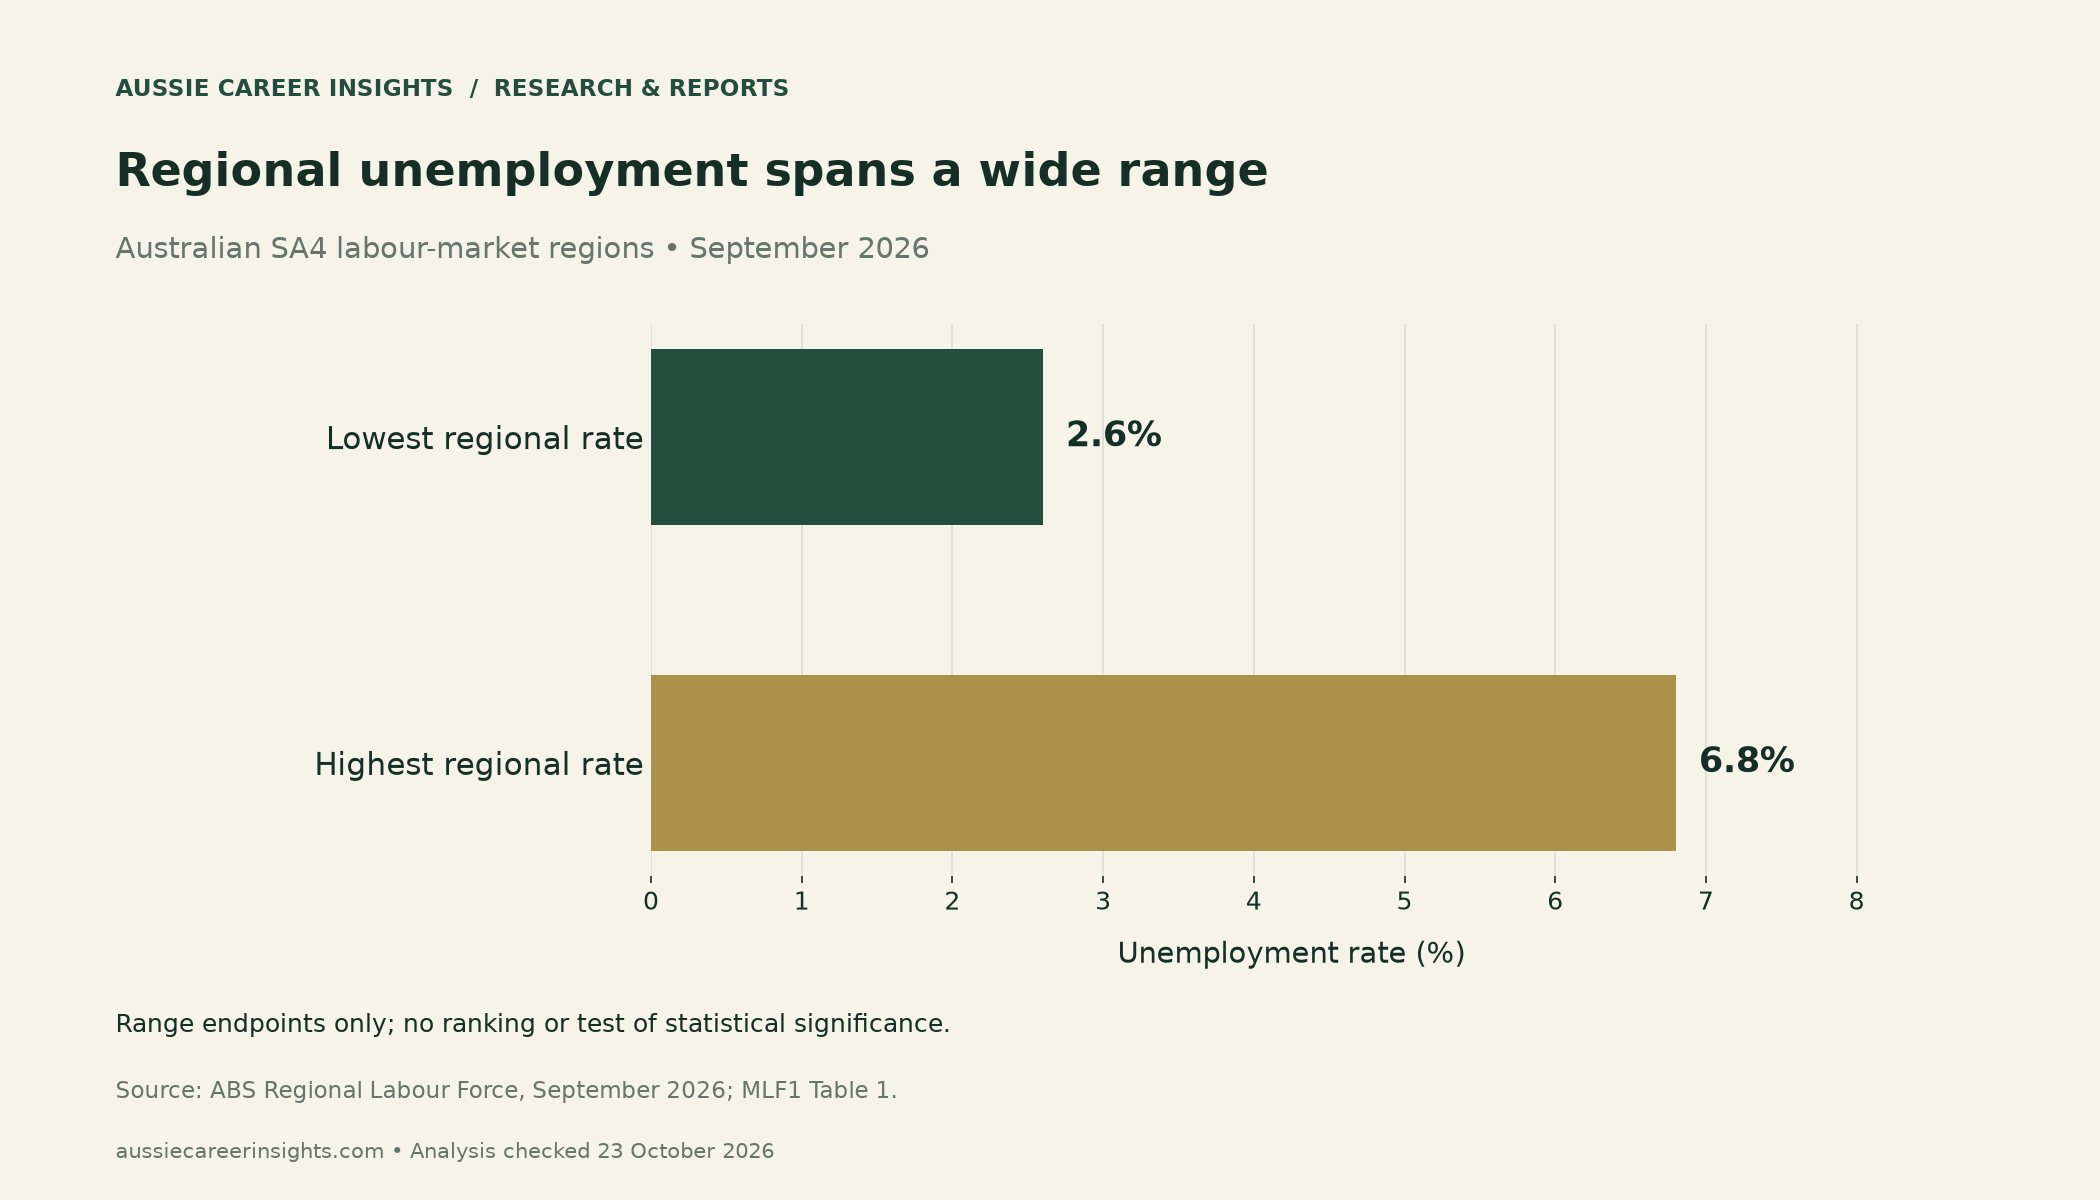
Across the regions, unemployment ranged from 2.6% to 6.8%. Participation ranged from 51.1% to 75.6%. Those broad differences make location worth investigating. Nevertheless, an area with low unemployment may have few suitable openings for your particular skills or schedule.
Local job markets can differ within one city
Sydney–Parramatta recorded 6.7% unemployment, compared with 2.6% in Sydney–Sutherland. The difference between these published one-decimal rates is 4.1 percentage points. This is an area-level comparison, not a measure of how much easier an application would be in Sutherland.
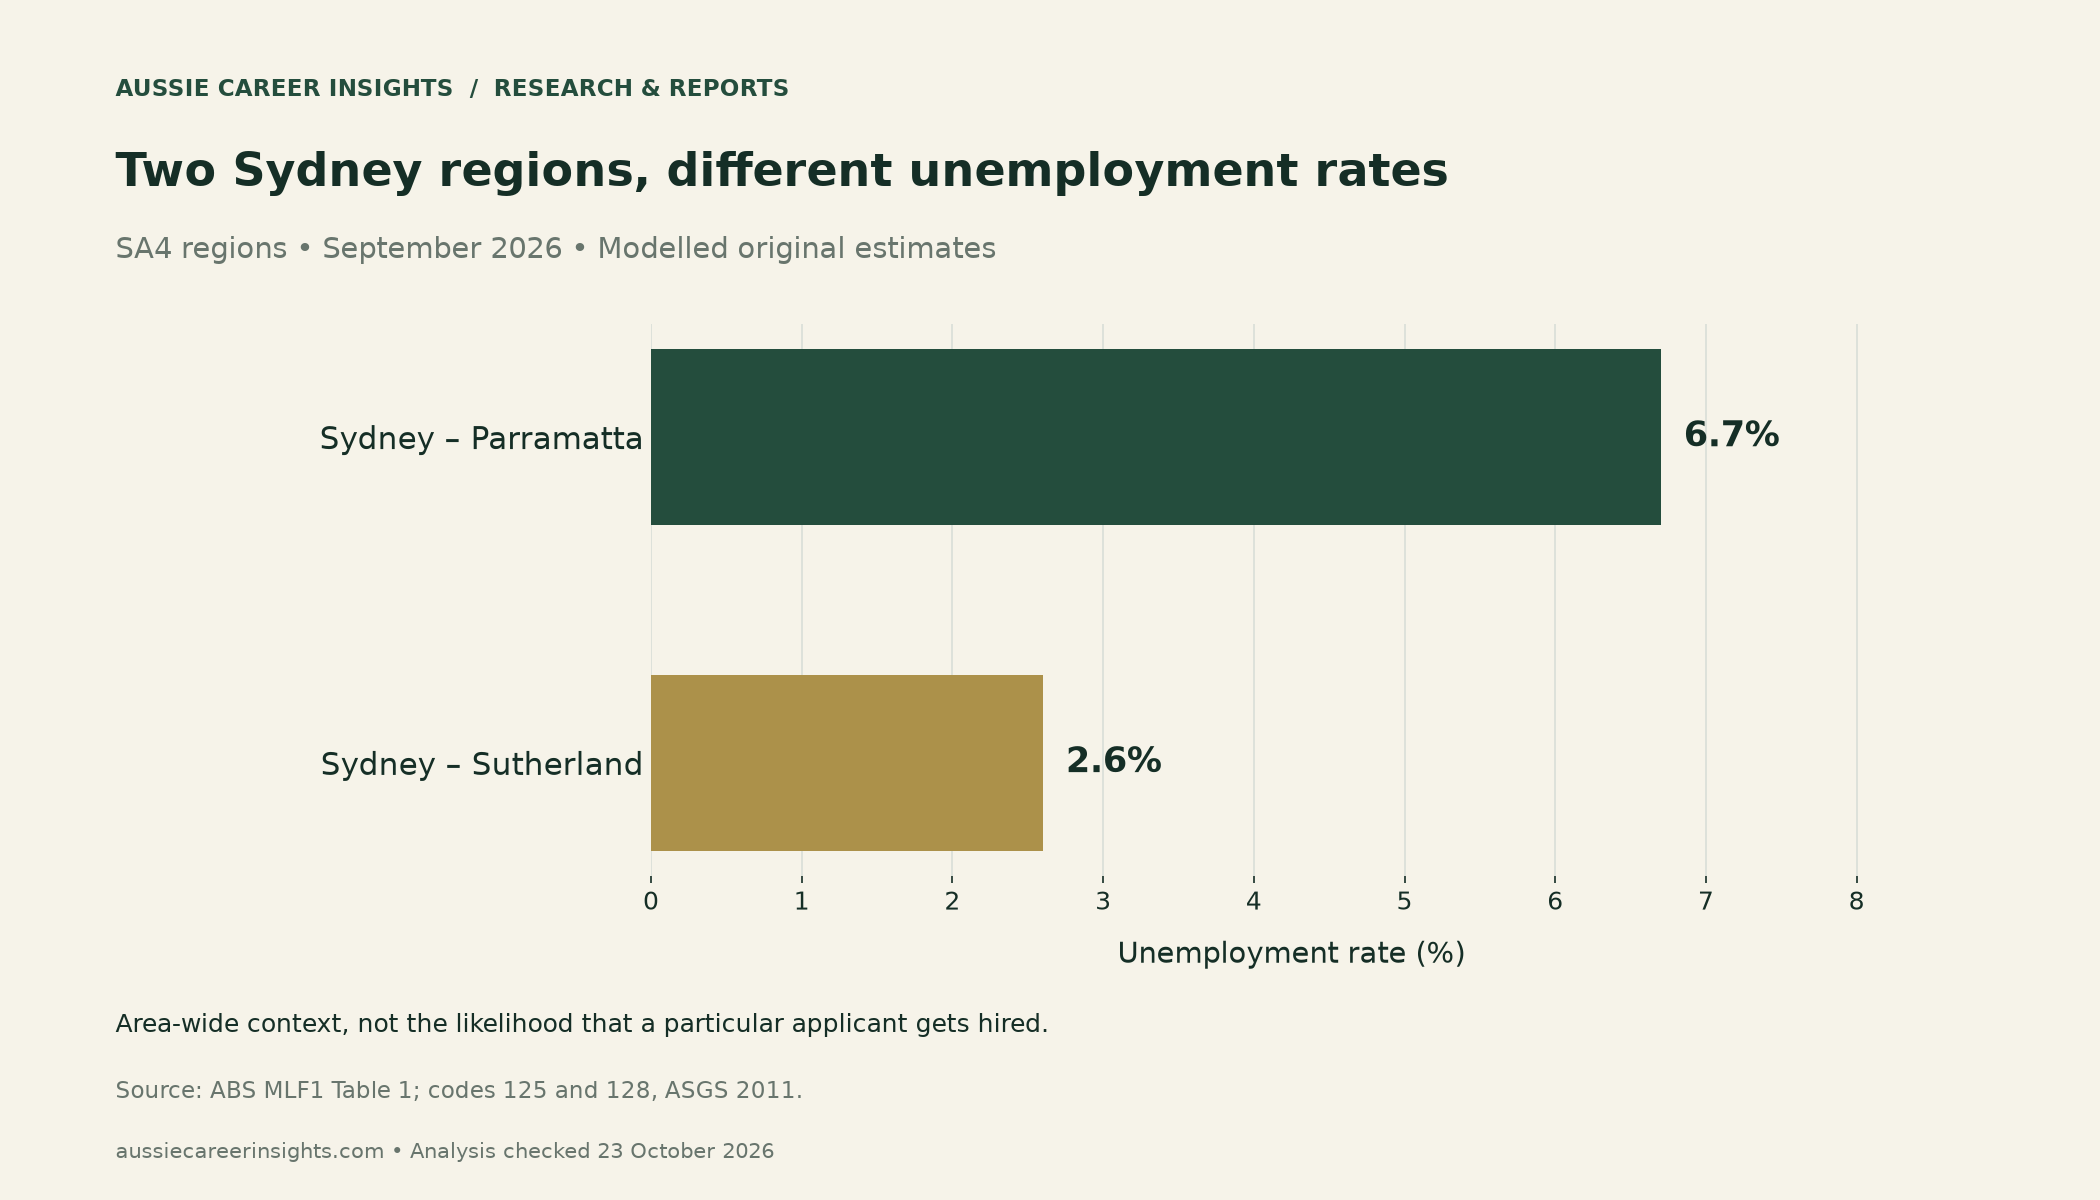
Also, these figures describe people by where they usually live. They do not count only jobs physically located inside each region. A resident may commute across an SA4 boundary. Consequently, a sensible search area should consider transport routes, onsite requirements and realistic travel time.
The regional names refer to statistical areas, not simply the named suburb or local council. Use the boundary and code shown in the dataset. The workbook labels these labour-market regions as ASGS 2011. Do not silently join them to a council map or a different boundary edition.
Why Melbourne needs a second measure
Melbourne–West recorded unemployment of 6.6%, versus 4.0% in Melbourne–Inner South. On its own, that comparison might encourage a simple better-versus-worse judgement. Yet the other measures complicate that reading.
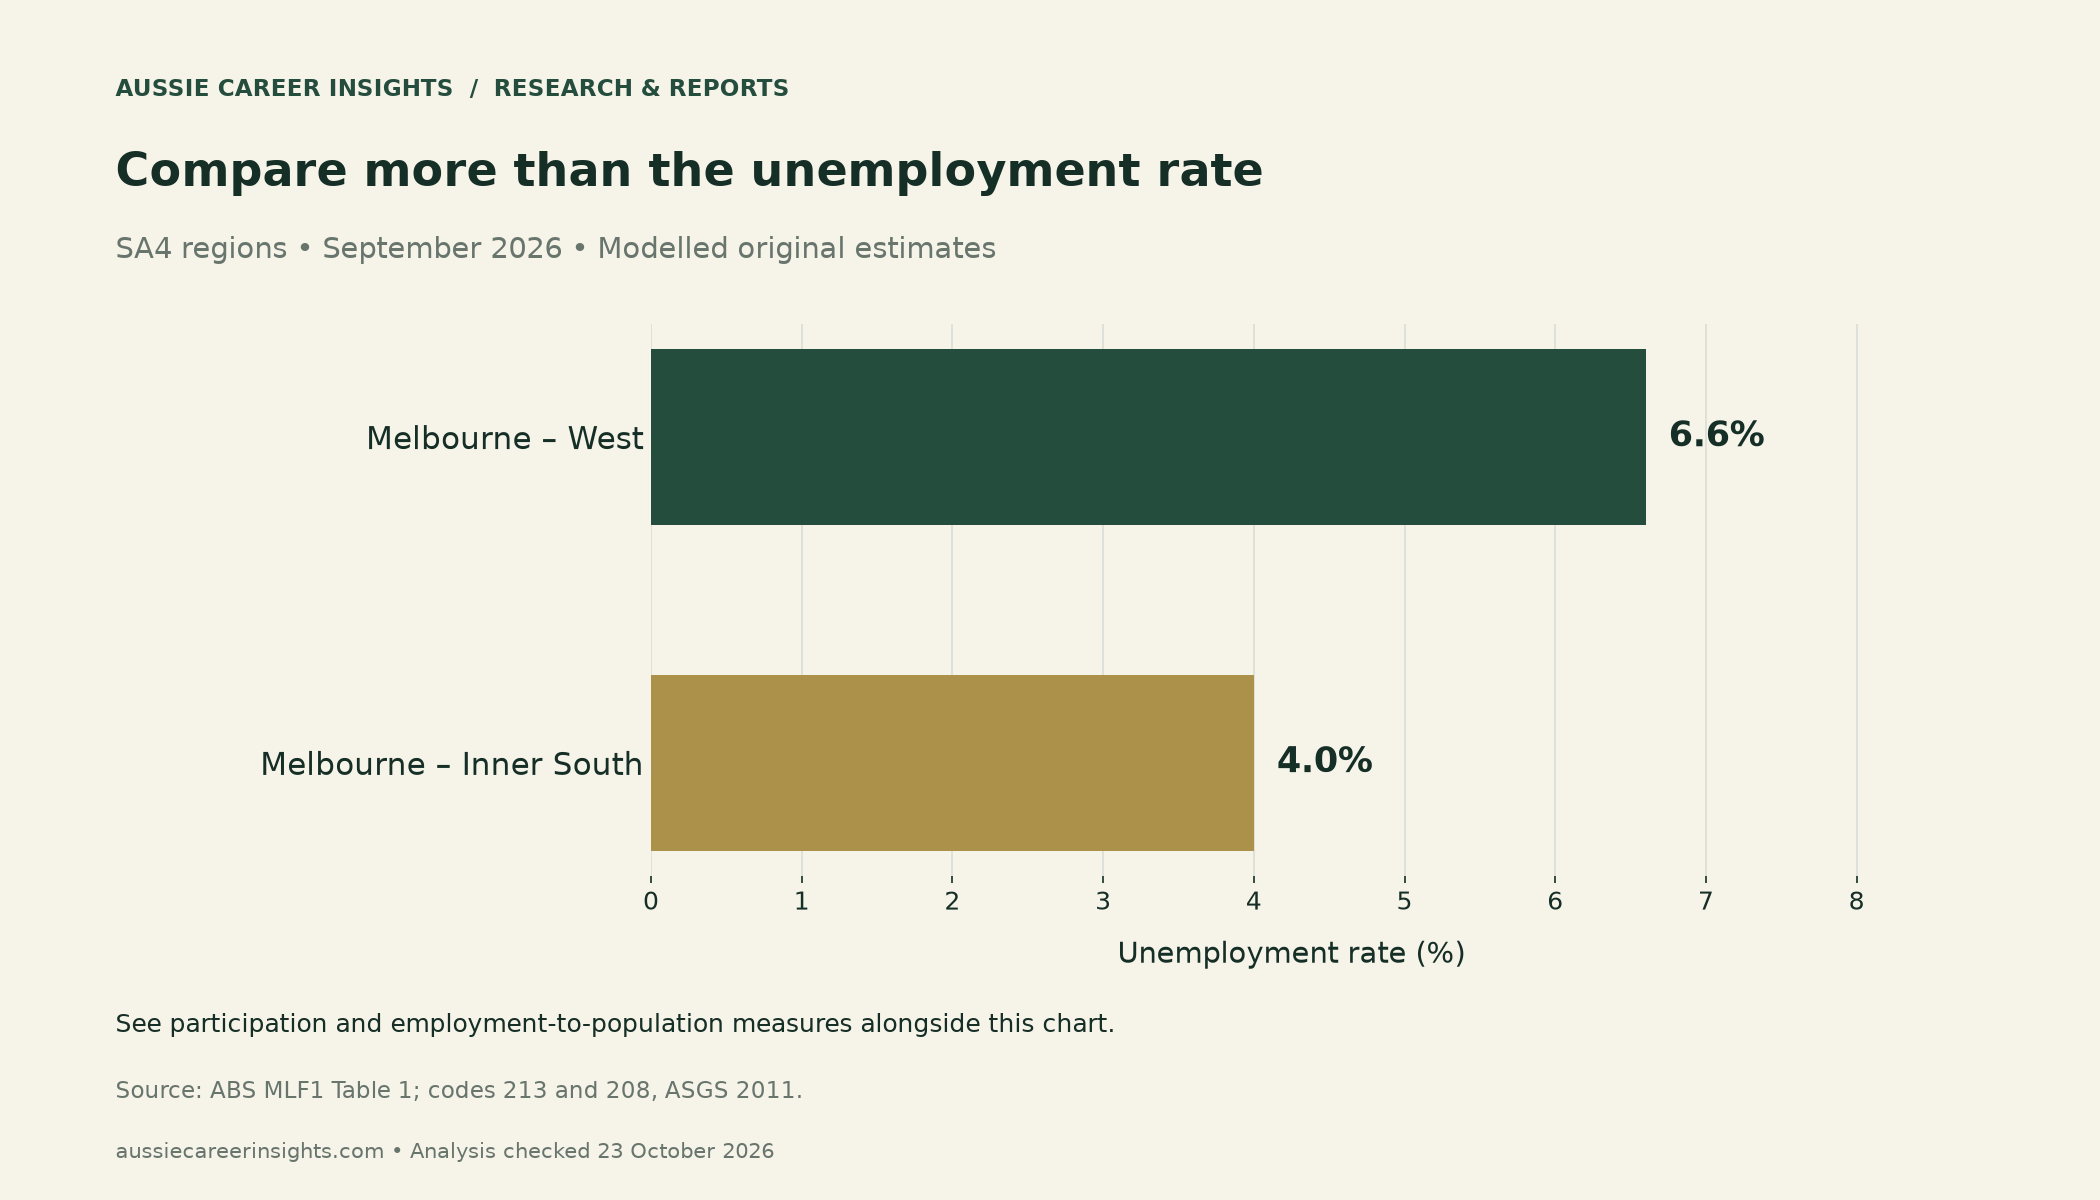
Unemployment divides unemployed people by the labour force, which includes employed and unemployed people. Participation instead divides that labour force by the civilian population aged 15 and over. The employment-to-population rate divides employed people by the same population. These denominators matter.
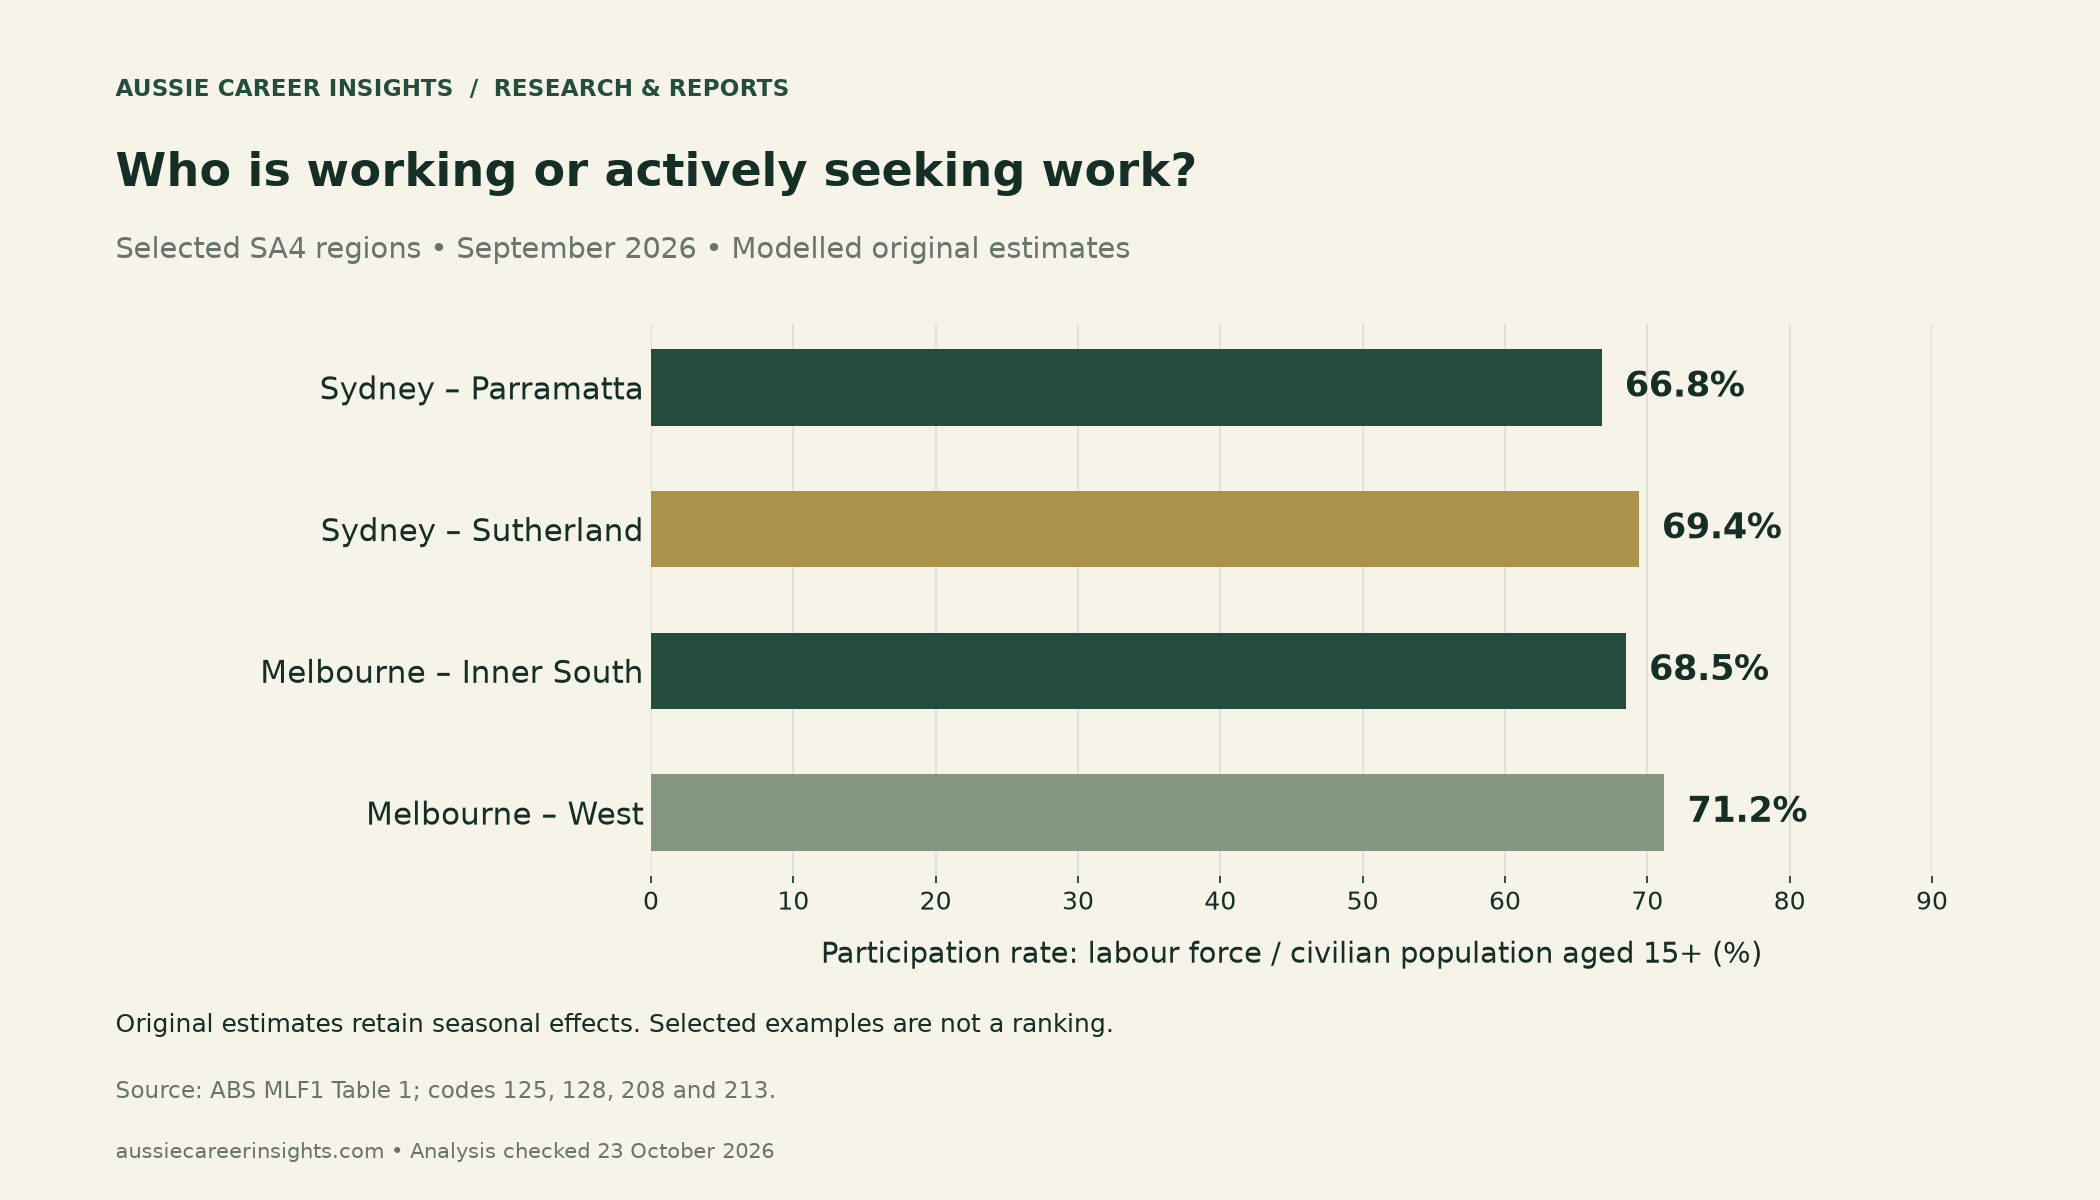
West had higher participation: 71.2%, compared with 68.5% in Inner South. It also had a slightly higher employed share of residents: 66.5% versus 65.8%. Thus, higher unemployment can coexist with a higher employment-to-population rate. The figures describe different aspects of participation in work.
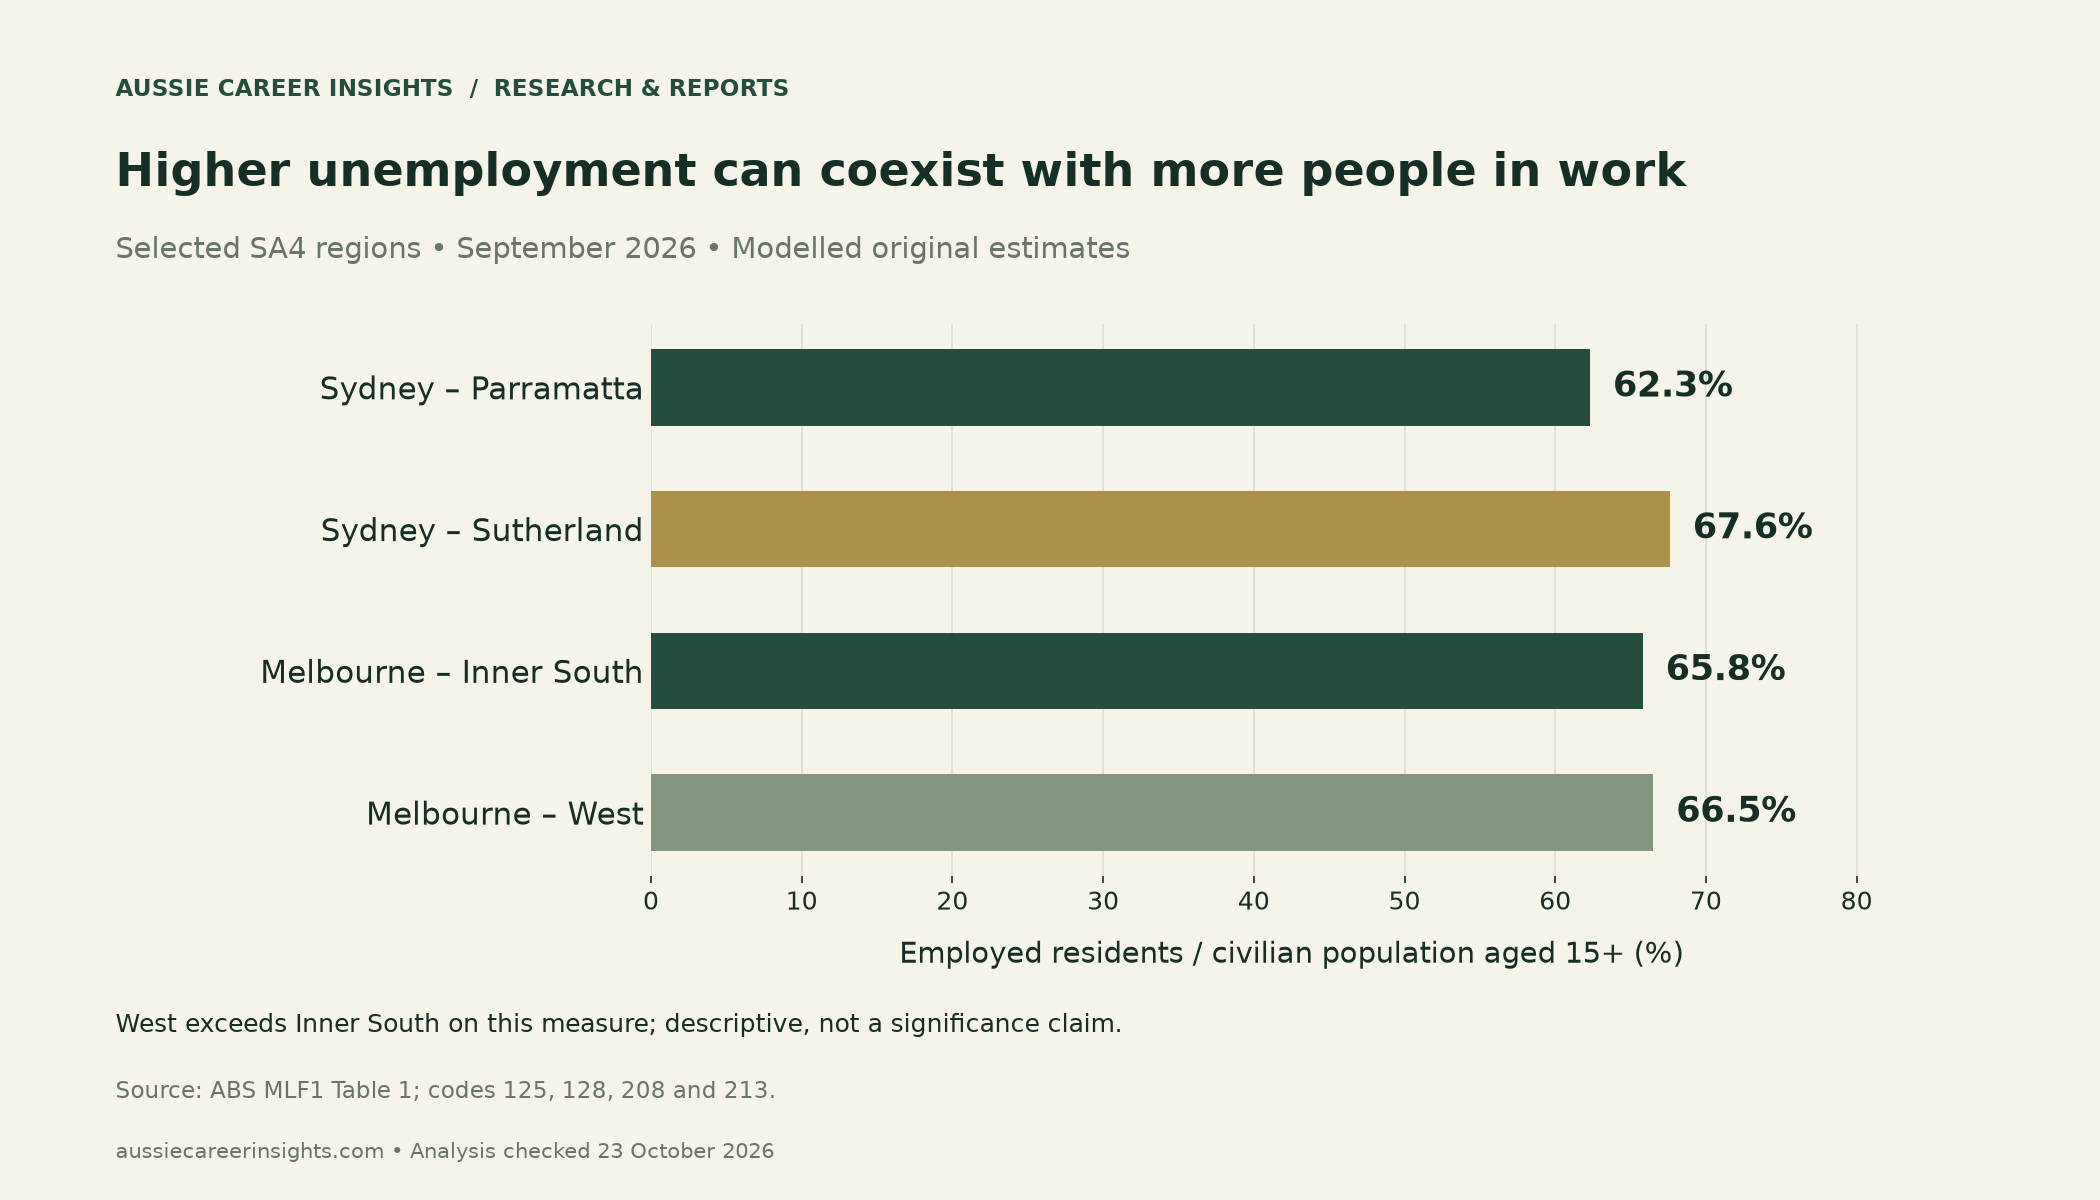
We have not adjusted these examples for age, occupation or household circumstances. Nor do they explain why the regions differ. For example, education and retirement patterns could affect participation, but this comparison does not measure their contribution. Avoid turning an interesting contrast into an unsupported causal claim.
A reusable table for comparing local job markets
| SA4 region and code | Unemployment | Participation | Employed / population |
|---|---|---|---|
| Sydney–Parramatta (125) | 6.7% | 66.8% | 62.3% |
| Sydney–Sutherland (128) | 2.6% | 69.4% | 67.6% |
| Melbourne–Inner South (208) | 4.0% | 68.5% | 65.8% |
| Melbourne–West (213) | 6.6% | 71.2% | 66.5% |
All values above refer to September 2026 and use modelled original estimates. Rates are rounded to one decimal. The last two columns use the civilian population aged 15 and over; unemployment uses the labour force. These selected examples are not a national ranking.
Build a three-location worksheet before relocating

Choose your present location and two realistic alternatives. Copy the following prompts into three columns. Leave unknown items blank until you can check them. This worksheet is our practical framework, not an ABS recommendation to move.
| Evidence to collect | What to record for each location |
|---|---|
| Geography and commuting | Correct SA4 code and boundary; worksite; travel time and cost. |
| Area-wide context | Unemployment, participation and employment-to-population rates from the same release. |
| Suitable vacancies | Dated employer links, required skills, experience, hours and work rights. |
| Achievable income | Actual offered base pay, guaranteed hours, overtime and superannuation terms. |
| Household costs | Current housing quotes, moving costs, transport and care commitments. |
| Decision threshold | Minimum acceptable offer; unresolved questions; conditions for staying put. |
Next, separate a labour-market signal from evidence about your role. Our mechanical drafting research compares regional demand with employers’ actual requirements. Its occupation-specific approach shows the extra work needed after an area looks promising.
Your Personalized Career Strategy
Unlock your potential with tailored career consulting. Get clear, actionable steps designed for your success. Start now!
Get StartedSimilarly, our shortage-list analysis explains why demand does not remove training or suitability barriers. For an offer comparison, the retail-to-warehouse report separates historical pay from guaranteed hours. Apply those distinctions to your own options.
If you are new to Australia, check work rights, qualification recognition and any occupation-specific registration separately. Regional unemployment does not establish visa eligibility or employer sponsorship. Ask the employer which requirements apply to the particular role before paying for a course or committing to a move.
Methodology, source files and limitations
Research checked on 23 October 2026. We preserved the original ABS MLF1 workbook and selected codes 125, 128, 208 and 213 from Table 1. We then independently aggregated 48 September rows from Data 1. The rows cover both sexes and six non-overlapping age bands across four regions. All three calculated rates matched Table 1 at source precision.
Charts round source values to one decimal. The Sydney and Melbourne gaps quoted above subtract the displayed rates, so they can differ from a gap calculated before rounding. We found no standard-error or confidence-interval fields in this workbook. Accordingly, we make no significance claims and do not rank the regions.
One reconciliation remains unresolved: the release reports a regional median unemployment rate of 4.4%, while our extraction of 87 uniquely coded workbook regions gives 4.3% after rounding. We exclude that median from our findings. The selected-region checks and national range endpoints agree with the release.
The ABS methodology explains how the estimates combine survey information, administrative data and patterns over time. Read it alongside the regional labour-market data guide and labour-force concepts guide before extending these comparisons. Modelled estimates can change with later releases.
Based on Australian Bureau of Statistics data, © Commonwealth of Australia, under the ABS Creative Commons Attribution 4.0 terms. Charts, selected comparisons and the worksheet are Aussie Career Insights adaptations. The featured and interior illustrations are AI-generated. ABS does not endorse this analysis.


