




For public sector jobs Australia 2026, the biggest search mistake is to look only at federal departments. State and territory employers held 2,048,800 employee jobs in June 2026, about 77.1% of the public-sector total. They also accounted for 91.6% of the annual increase. That makes state services an important part of a well-targeted employer search.
However, these are filled jobs, not advertised vacancies or new hires. The ABS release published on 5 November 2026 describes June employment. It cannot tell you which employer is recruiting today, whether a particular role is secure or your chance of getting an offer.
This report separates the size of the workforce from its growth. It then maps those findings to official recruitment routes and a practical, private shortlist worksheet. All figures below cover Australia’s public sector unless stated otherwise.
Public sector jobs Australia 2026: the three levels
Australia had 2,657,400 public-sector employee jobs in June 2026, up 60,300, or 2.3%, from June 2025. The state and territory level was much larger than either the Commonwealth or local government. Therefore, a search restricted to Canberra or APS departments misses a substantial part of the employer landscape.
| Government level | June 2025 jobs | June 2026 jobs | Annual increase |
|---|---|---|---|
| Commonwealth | 385,500 | 389,200 | 3,700 |
| State and territory | 1,993,600 | 2,048,800 | 55,200 |
| Local | 218,000 | 219,400 | 1,400 |
| Total | 2,597,100 | 2,657,400 | 60,300 |
Source: ABS, June employee-job estimates. The table converts the published thousand-job figures into jobs. These figures describe jobs rather than unique workers or full-time-equivalent positions.
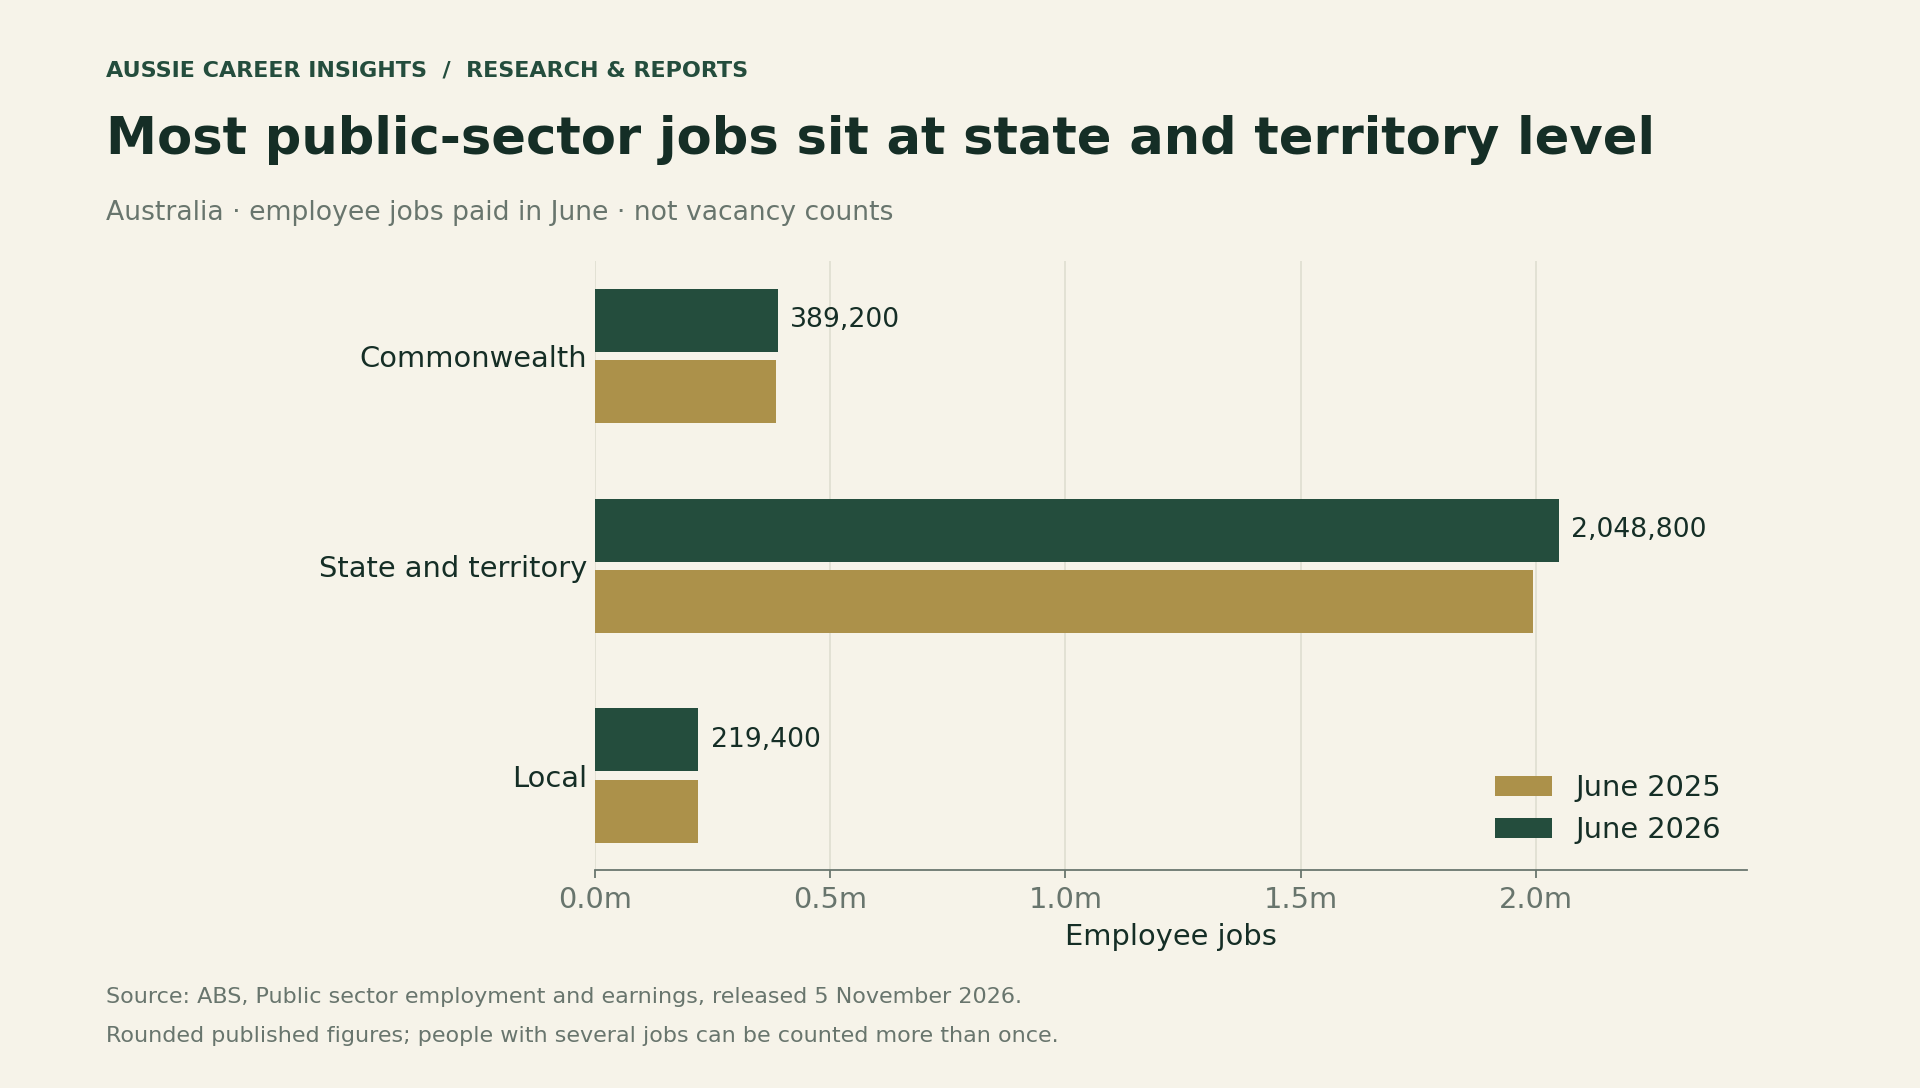
The classification is broader than government office work. The ABS methodology includes public corporations, public universities and the Australian Defence Force. Public universities are assigned to a government level using the legislation under which they were established. Consequently, “state and territory” should not be read as a list containing only departmental employees.
Where the annual growth occurred
State and territory employers added 55,200 jobs, compared with 3,700 at Commonwealth level and 1,400 in local government. ABS reports annual increases of 2.8%, 1.0% and 0.6%, respectively. These rates use each level’s own previous-year base.
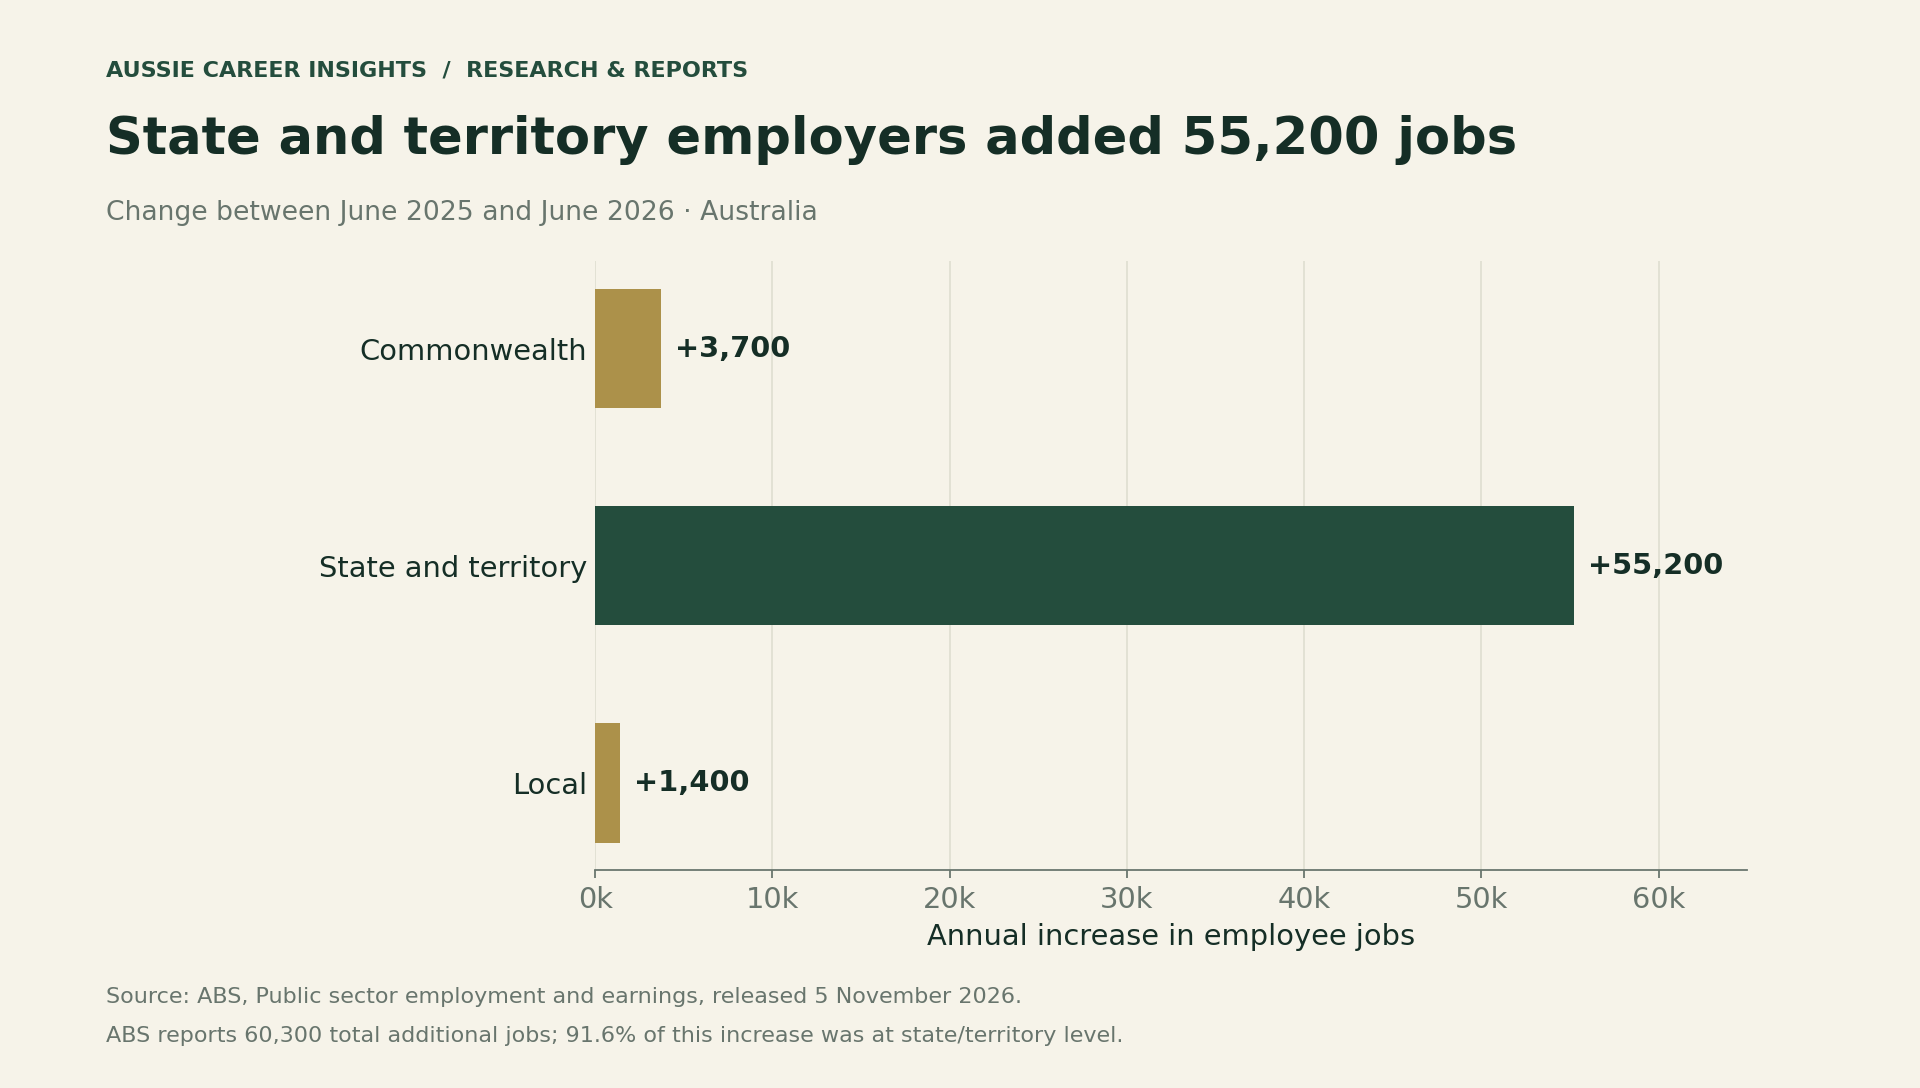
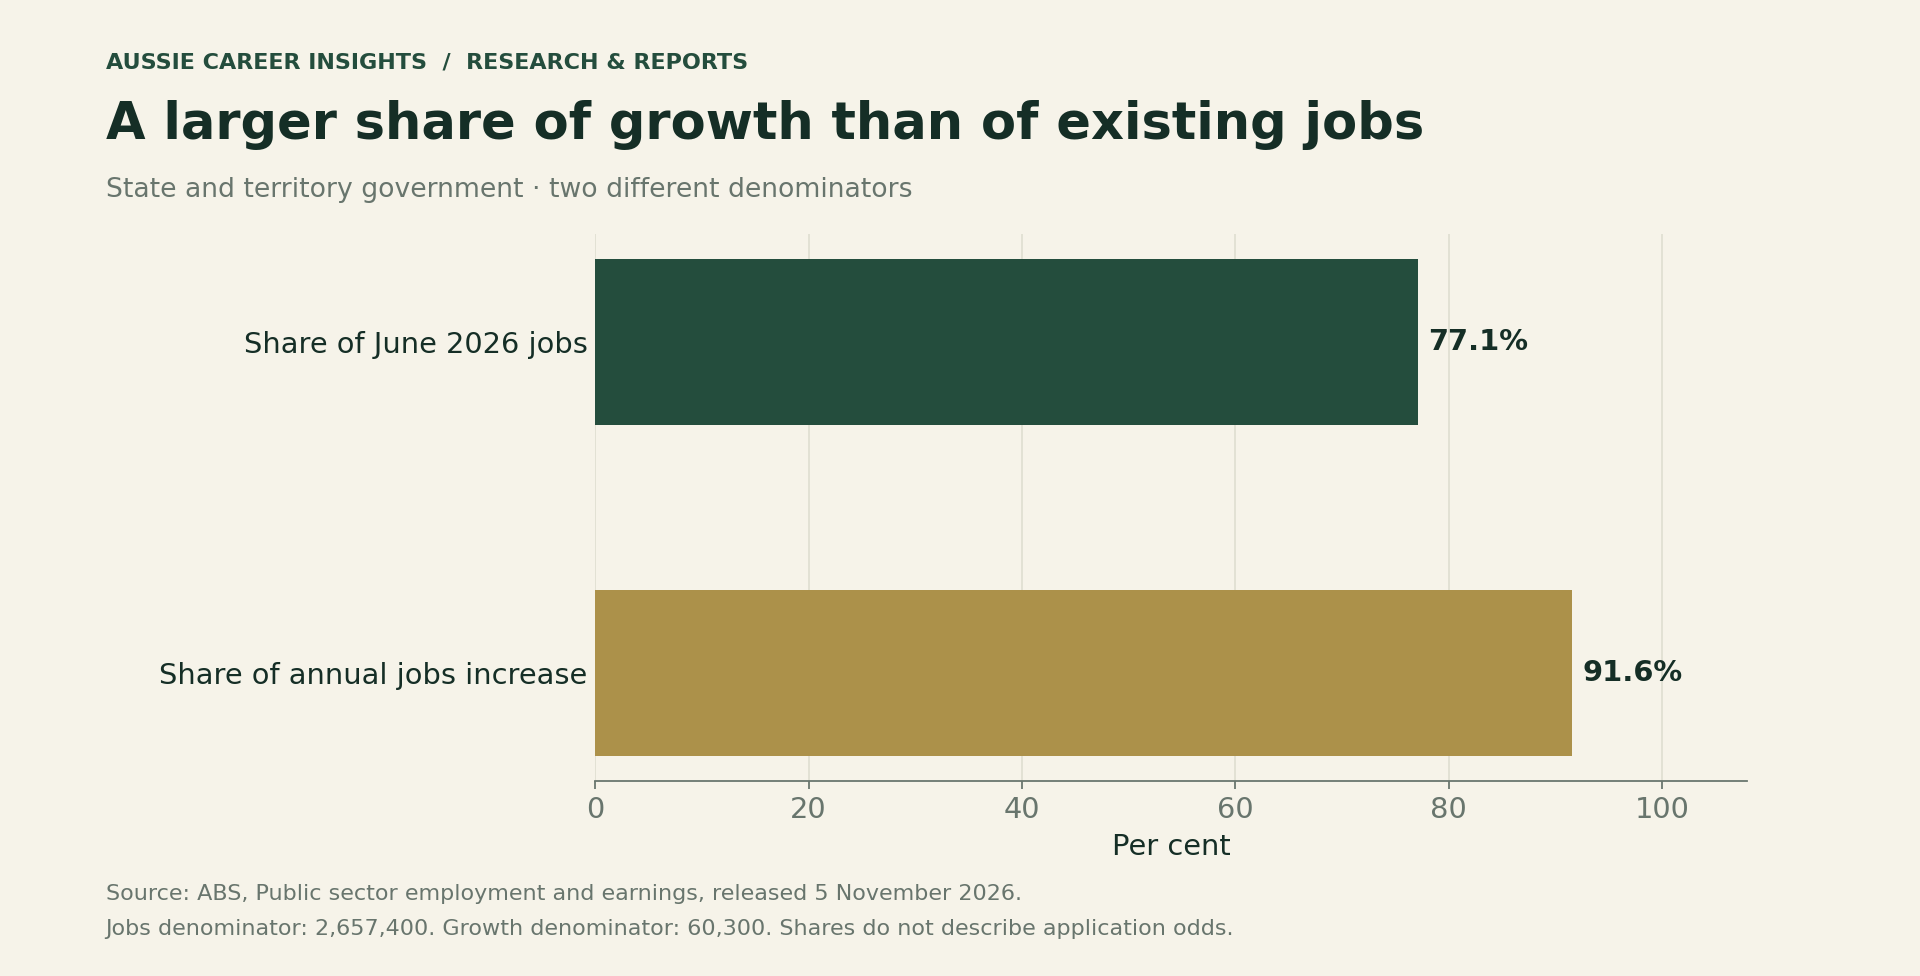
There are two useful questions here. First, where are most existing public-sector jobs? Second, where did the total grow most over the year? The answers both point to state and territory employers, but the percentages use different denominators.
Our 77.1% workforce share divides 2,048,800 by 2,657,400. The 91.6% growth contribution is the ABS’s reported share of the 60,300-job annual increase. Neither percentage is an applicant success rate. Nor should you allocate 91.6% of your applications mechanically to state jobs: your qualifications, location and actual advertised roles matter more.
Look beyond the public administration label
The industry breakdown helps explain why a broader search matters. Public administration and safety held 883,300 jobs, education and training 790,800, and health care and social assistance 699,800. These are public-sector jobs within those industries, not employment across their private and public employers combined.
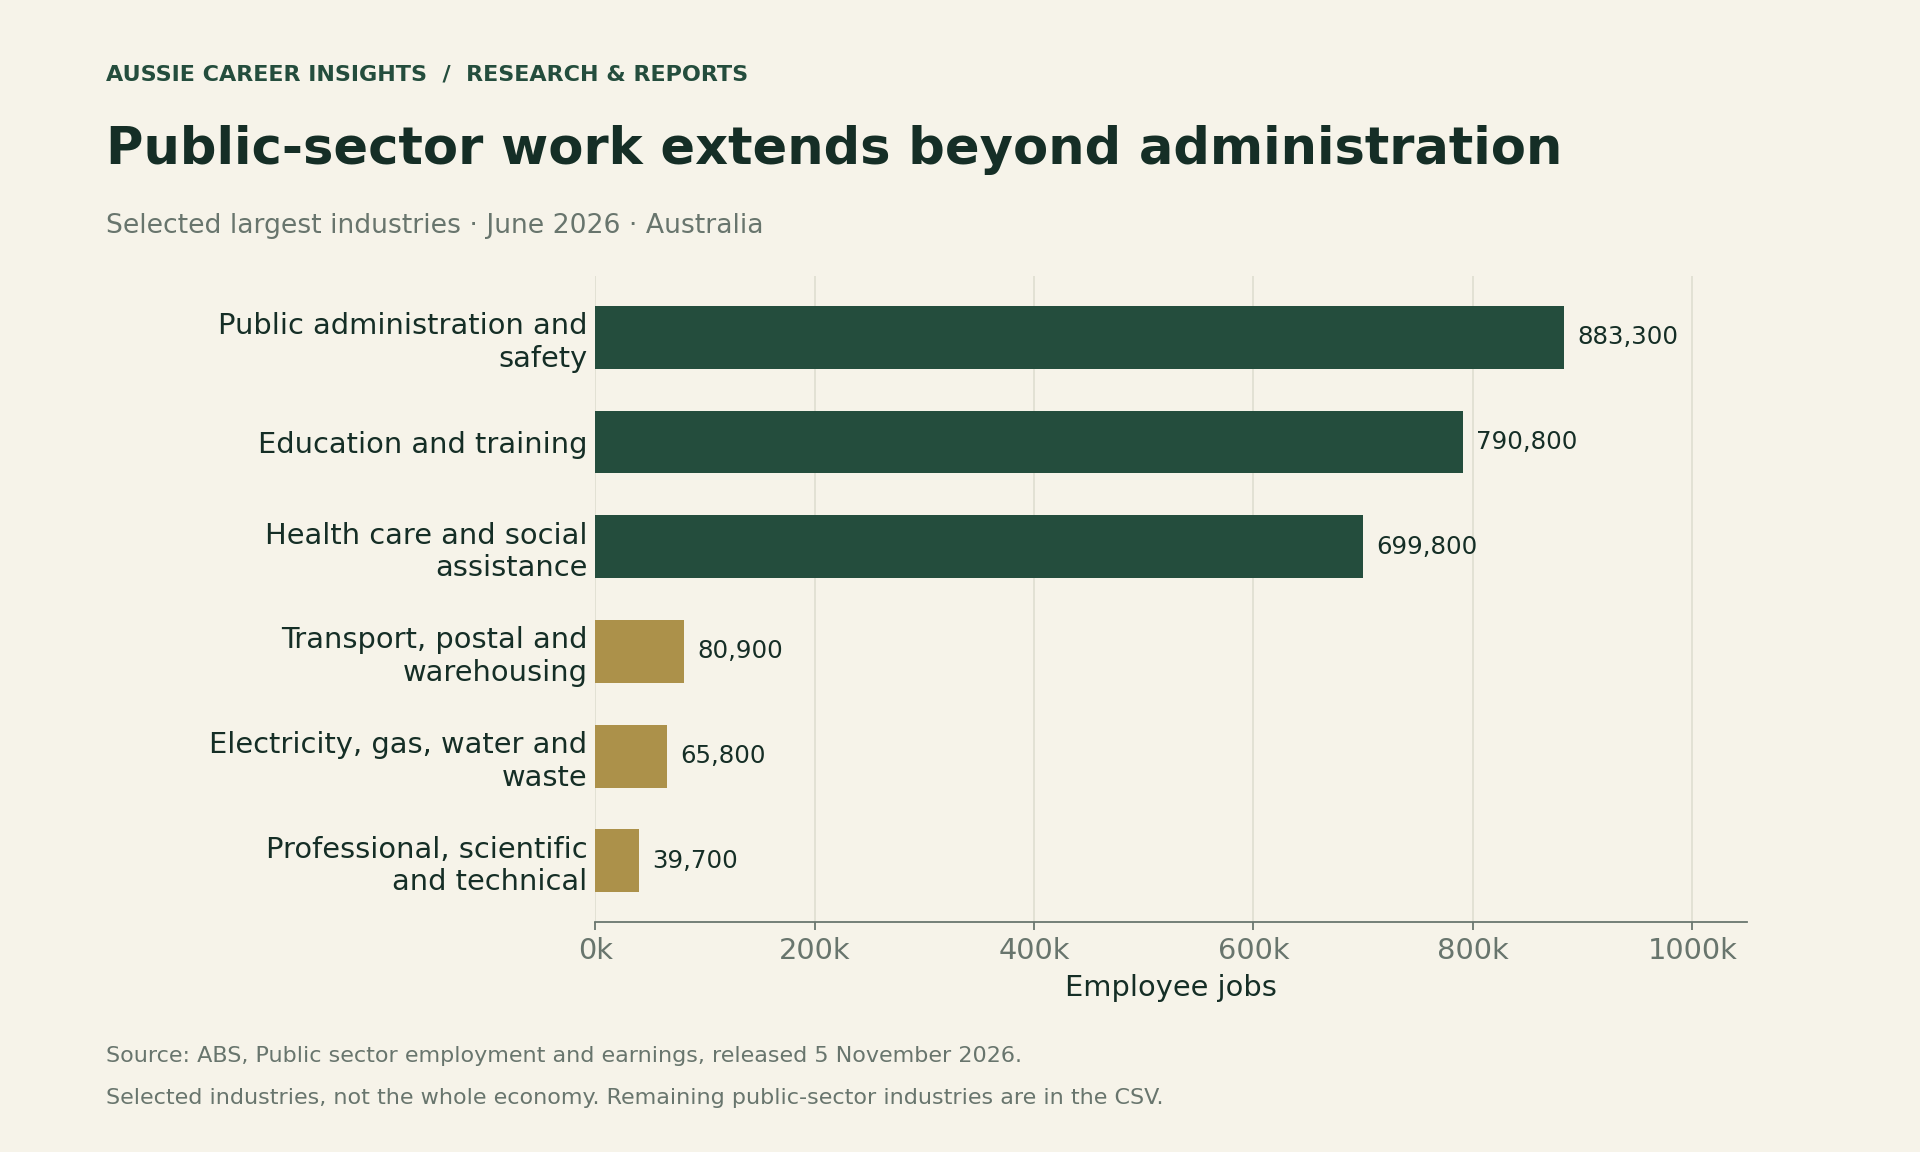
For example, a technology specialist can search for relevant roles within health, education or transport employers. Likewise, an experienced procurement or finance worker can consider the employing organisation rather than assuming their function appears in a similarly named industry. The ABS industry classification describes the employer’s activity; it does not identify every employee’s occupation.
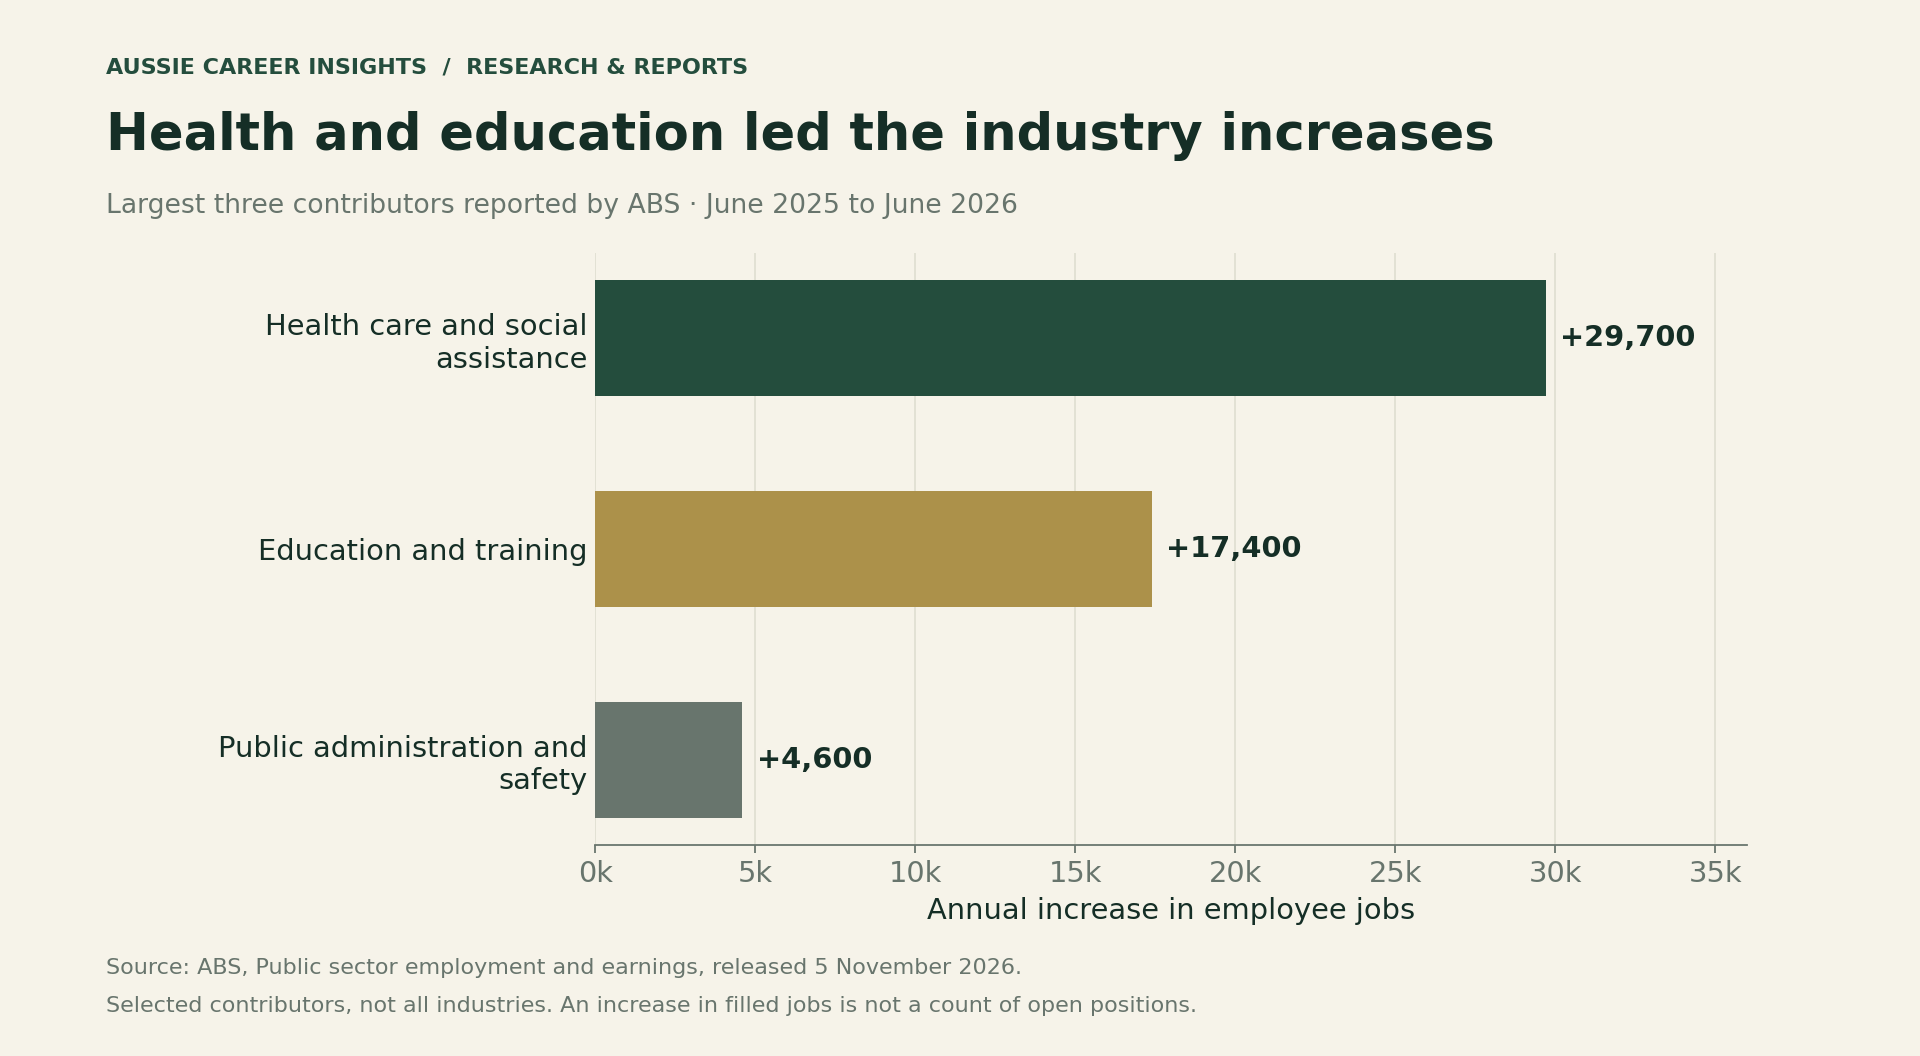
Health care and social assistance added 29,700 jobs over the year. Education and training added 17,400, while public administration and safety added 4,600. ABS identifies these as the three largest industry contributors. However, an industry increase does not establish a shortage in your occupation, city or seniority level.
Turn the statistics into an employer shortlist
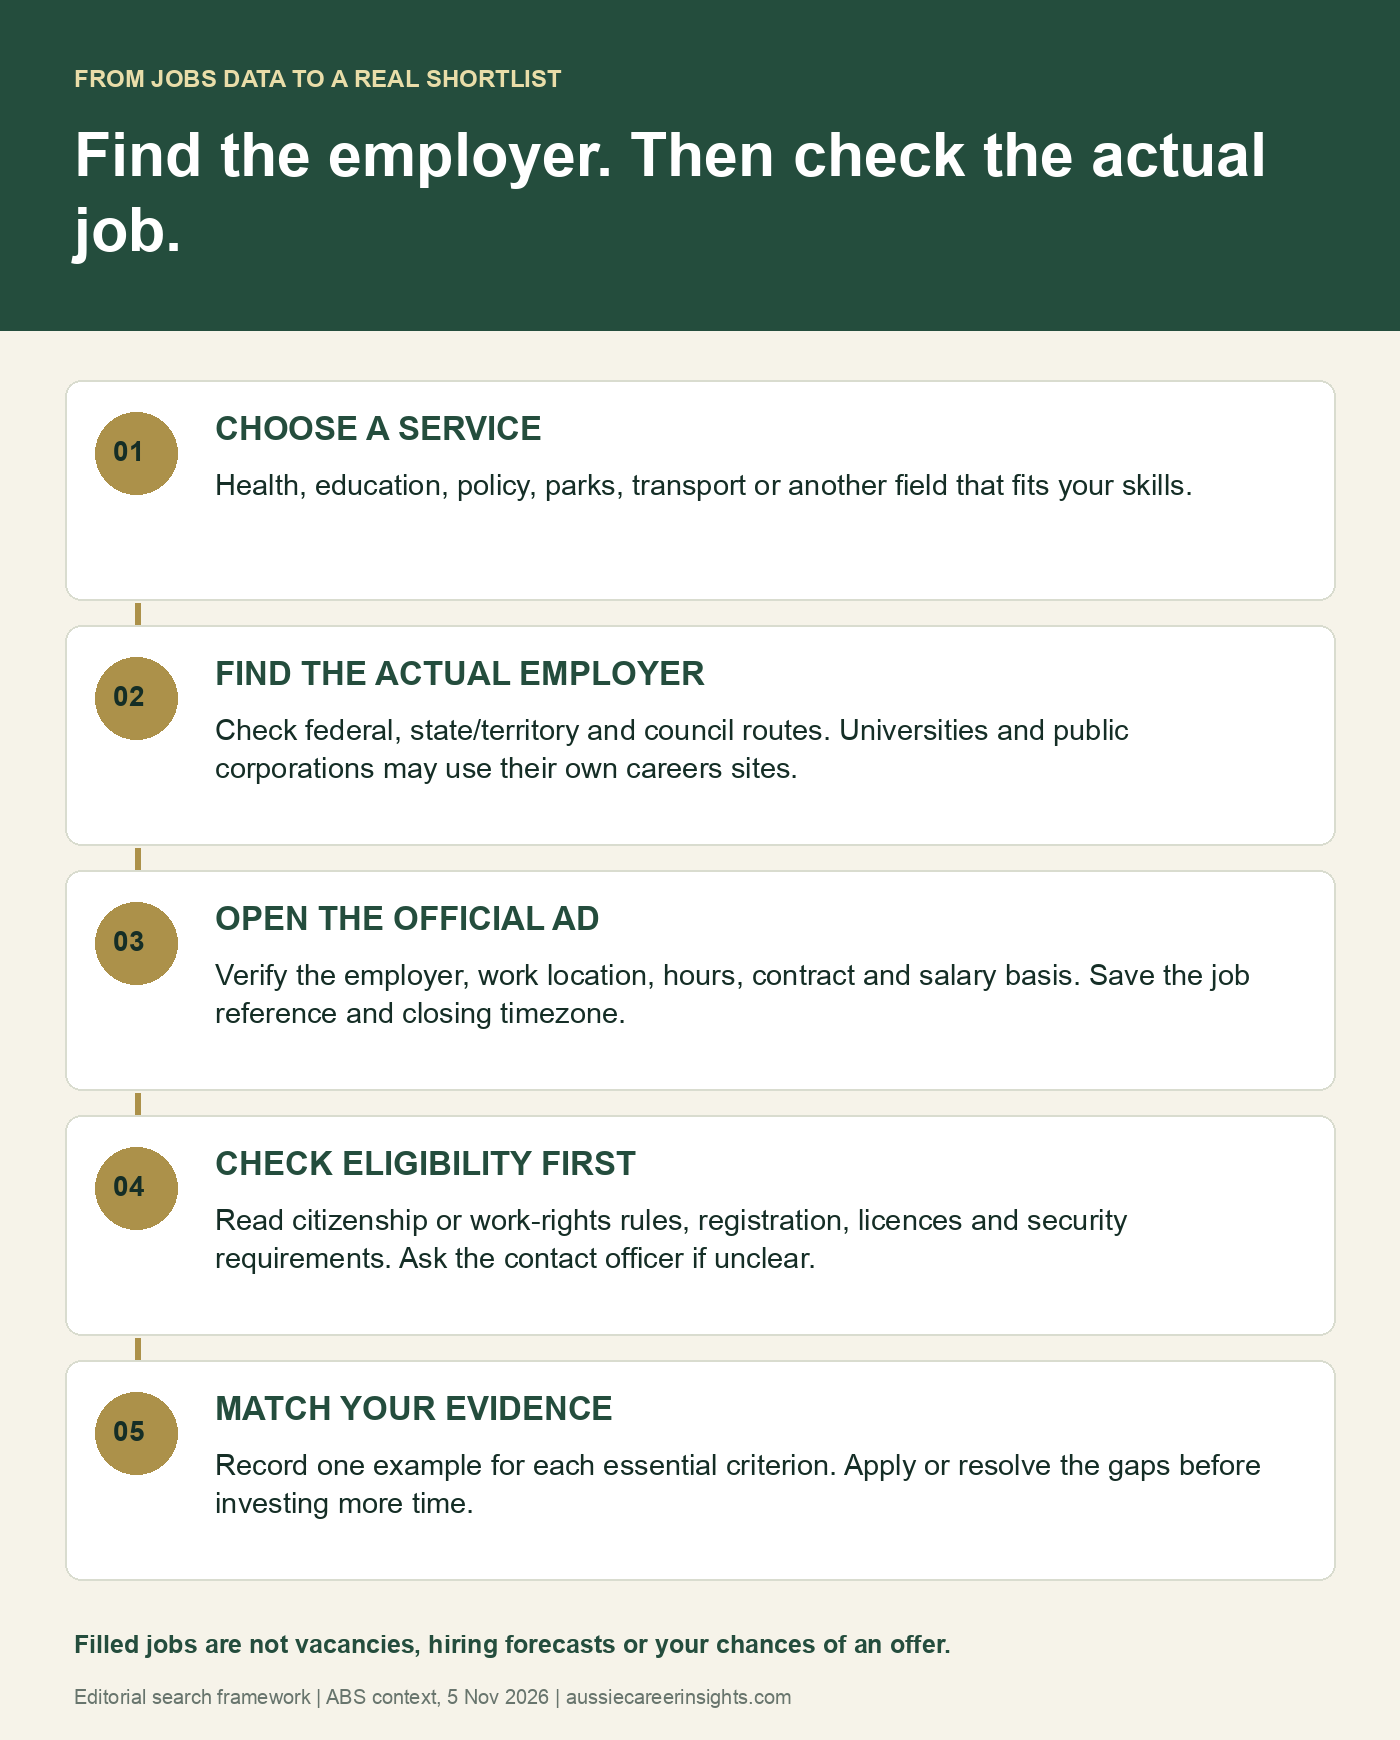
Start with a service area and a realistic commuting or relocation boundary. Next, identify the actual employer. A hospital, university, council or public corporation may have its own recruitment site. A broad government jobs portal is a starting point rather than a complete list of every employer counted by ABS.
Official recruitment starting points
The following official routes were checked on 6 November 2026. They are examples to start a search, rather than an exhaustive national directory or a guarantee that suitable vacancies are open.
| Search route | Useful starting point | Check before applying |
|---|---|---|
| Australian Public Service | APS Jobs | Agency, location, citizenship, security and classification requirements |
| NSW public sector | I Work for NSW | Actual employer, position description, work rights and registration |
| Queensland government | Smart Jobs | Agency, role location, mandatory qualifications and closing time |
| ACT Public Service | ACT careers | Employment eligibility and the requirements in the specific advertisement |
| Brisbane City Council | Council careers | Follow the council’s current-jobs link and read the individual role pack |
Check eligibility and your evidence
Eligibility varies. The Australian Public Service Commission’s application guidance explains that Australian citizenship is generally expected, although agencies may choose to employ eligible non-citizens. In contrast, ACT’s published baseline eligibility guidance includes people with a current visa with work rights. Additional role requirements can still apply.
Your Personalized Career Strategy
Unlock your potential with tailored career consulting. Get clear, actionable steps designed for your success. Start now!
Get StartedAs a result, residents and newcomers should read the actual job pack and ask the listed contact officer about unclear conditions. Do not assume that permanent residence alone qualifies you for every federal role, or that one agency’s rule applies to every state employer.
For each shortlisted role, record the official URL, job reference, location, essential qualifications, work-rights conditions and deadline timezone. Then add a concrete example showing how you meet each essential criterion. Keep personal documents in your own secure files; this worksheet does not need passport numbers or other identity identifiers.
When comparing an offer, separate base salary, superannuation, hours and contract length. Our underpayment evidence checklist also shows how to organise pay-period records if you later need to investigate a pay discrepancy. Historical workforce growth alone does not establish an individual pay entitlement.
Download the data and search tools
Use the source-linked tables to reproduce the figures. The industry CSV includes all twelve displayed ABS industry groups, including its combined “other industries” category. Shortened chart labels are documented in the file. Blank worksheet rows are intentional.
- Government-level jobs and calculated workforce shares (CSV)
- Public-sector industry jobs and changes (CSV)
- Official employer-search starting routes (CSV)
- Blank public-employer shortlist worksheet (CSV)
Methodology, limitations and citation
We used the 5 November 2026 ABS release for the 2025–26 financial year, checked on 6 November. Its job estimates refer to June 2026, with June 2025 comparisons from the same release. We multiplied published values expressed in thousands by 1,000 and calculated the state and territory workforce share. The annual growth-contribution figure and the three highlighted industry changes follow ABS’s stated results.
ABS combines Single Touch Payroll administrative data with its Business Register. An employee job depends on positive June wage, salary or salary-sacrifice payments. A person with multiple jobs may contribute more than one job. These estimates do not measure hours, full-time equivalents, current vacancies, recruitment success or future job security. Geography reflects employer operations rather than workers’ home addresses.
Published components are rounded; ABS calculates totals using unrounded values. Therefore, some industry totals or changes derived from displayed figures can differ slightly from the official total or stated movement. Our charts keep government-level and industry classifications separate to avoid double-counting the same workforce.
We have not calculated an “average public-sector salary” by dividing the annual wage bill by June jobs. ABS specifically discourages this calculation because the reference periods differ. For an actual offer, use the advertisement, classification schedule and applicable employment terms instead.
Suggested citation: Aussie Career Insights (6 November 2026), “Public Sector Jobs Australia: Where the 2026 Growth Happened,” analysis of ABS Public sector employment and earnings, 2025–26. Cite ABS as the underlying data source and this report for its charts, derived share and employer-search framework. Official recruitment pages and individual advertisements can change after the checking date.


