




A claim about AI job losses in Australia needs a careful source check: JSA’s 139,000 figure is not an AI layoff forecast. It describes a conditional difference from baseline employment growth. The model behind that figure does not include AI’s impact.
That distinction matters if you are considering a course, changing roles or deciding which skills to build. An alarming number can sound precise while answering a different question from the one you face. Before acting, identify what the source measured, what it compared and what it left out.
We checked the original clarification on 30 October 2026. This guide explains the comparison, separates the official figures from a fictional example, and provides a claim-check worksheet. It cannot predict an individual’s automation exposure or promise that any role is safe.
What JSA corrected on 27 October
In its 27 October clarification, Jobs and Skills Australia addressed reporting about its 2026 Jobs and Skills Report. The scenario assumes education and career choices respond to labour-market demand. Its comparison runs over the next decade, relative to baseline projected growth.
The stated differences are 139,000 fewer Skill Level 1 workers and 106,000 more Skill Level 3 and 4 workers combined than baseline. Skill Level 1 still contributes 47% of total employment growth in that scenario. JSA says the model excludes AI, geopolitical conflict and similar disruptions.
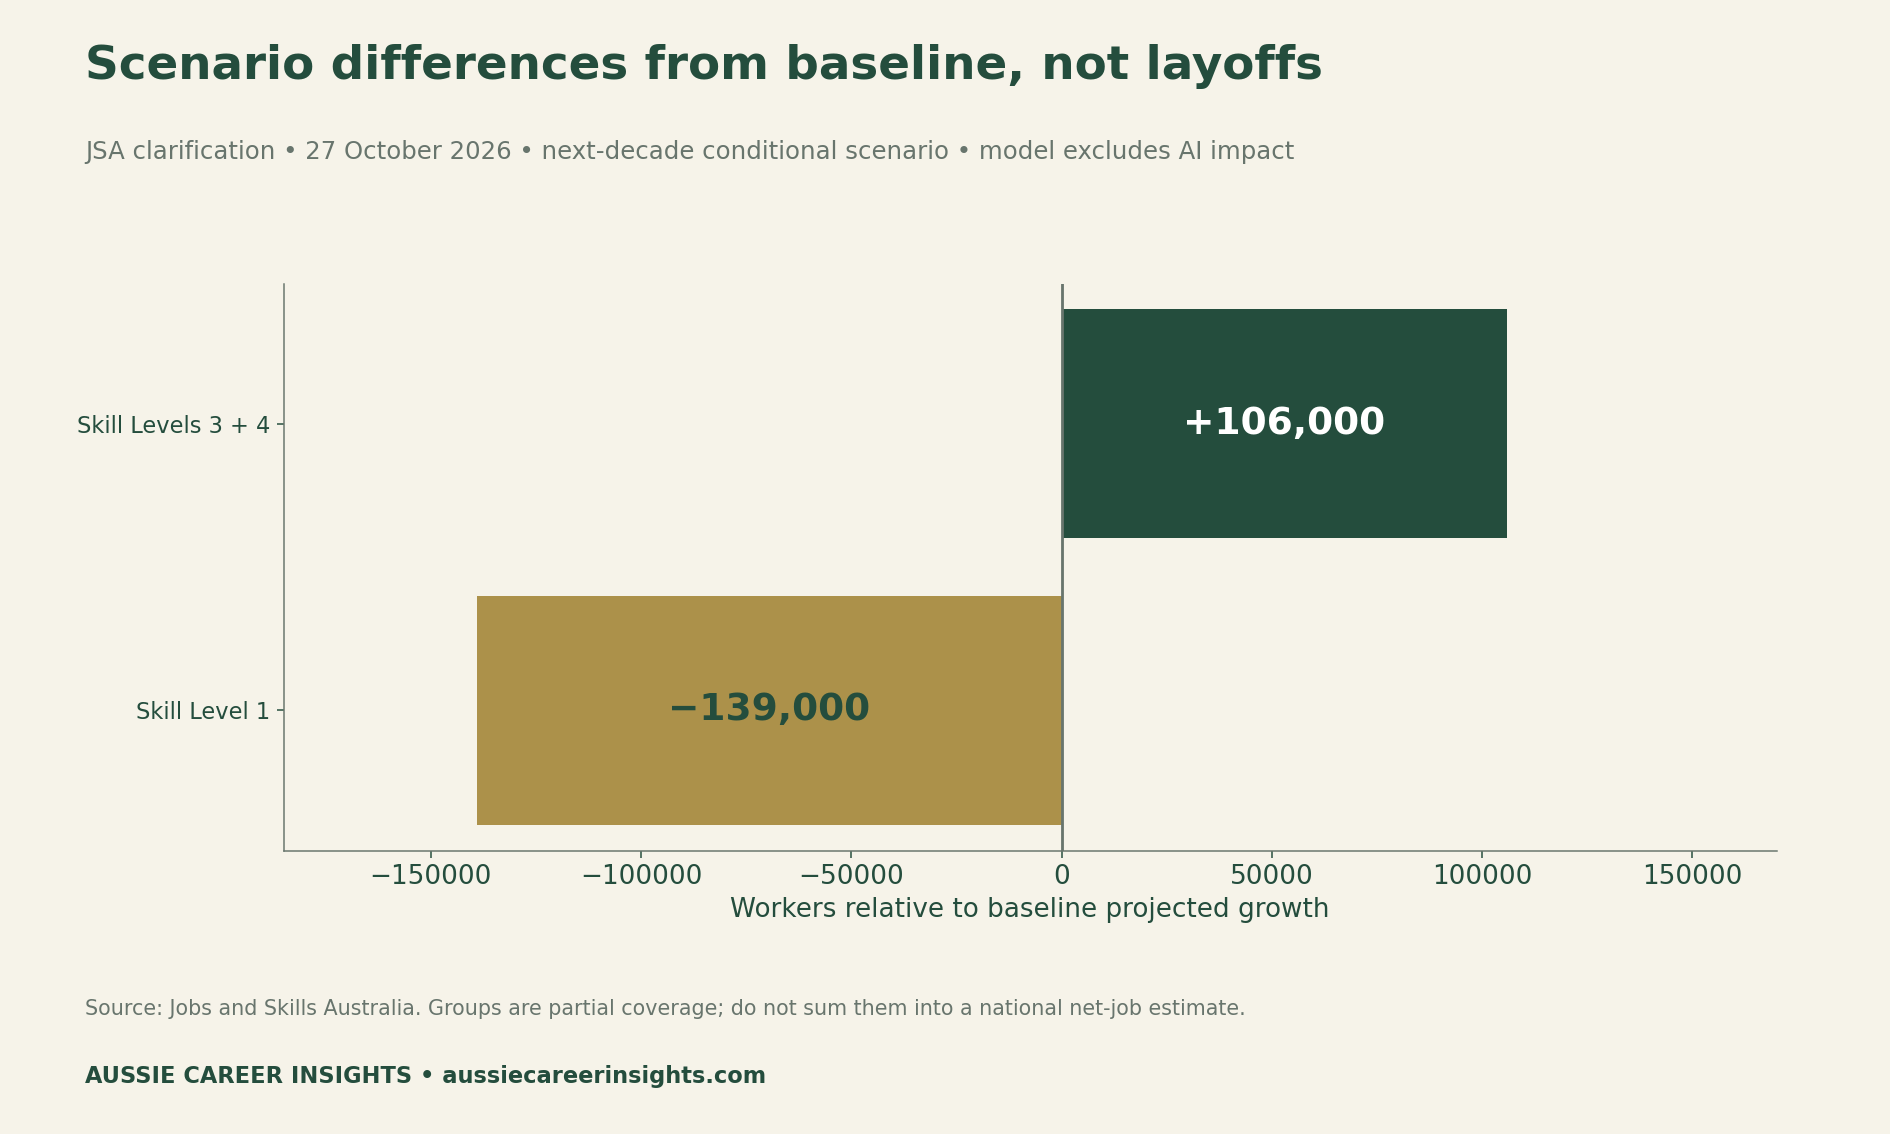
The official clarification therefore does not support treating the number as recorded dismissals or as jobs AI will remove. Equally, correcting that interpretation does not establish that AI has no effect on work. A model that excludes an effect cannot settle the wider question about that effect.
Keep percentages separate from worker counts
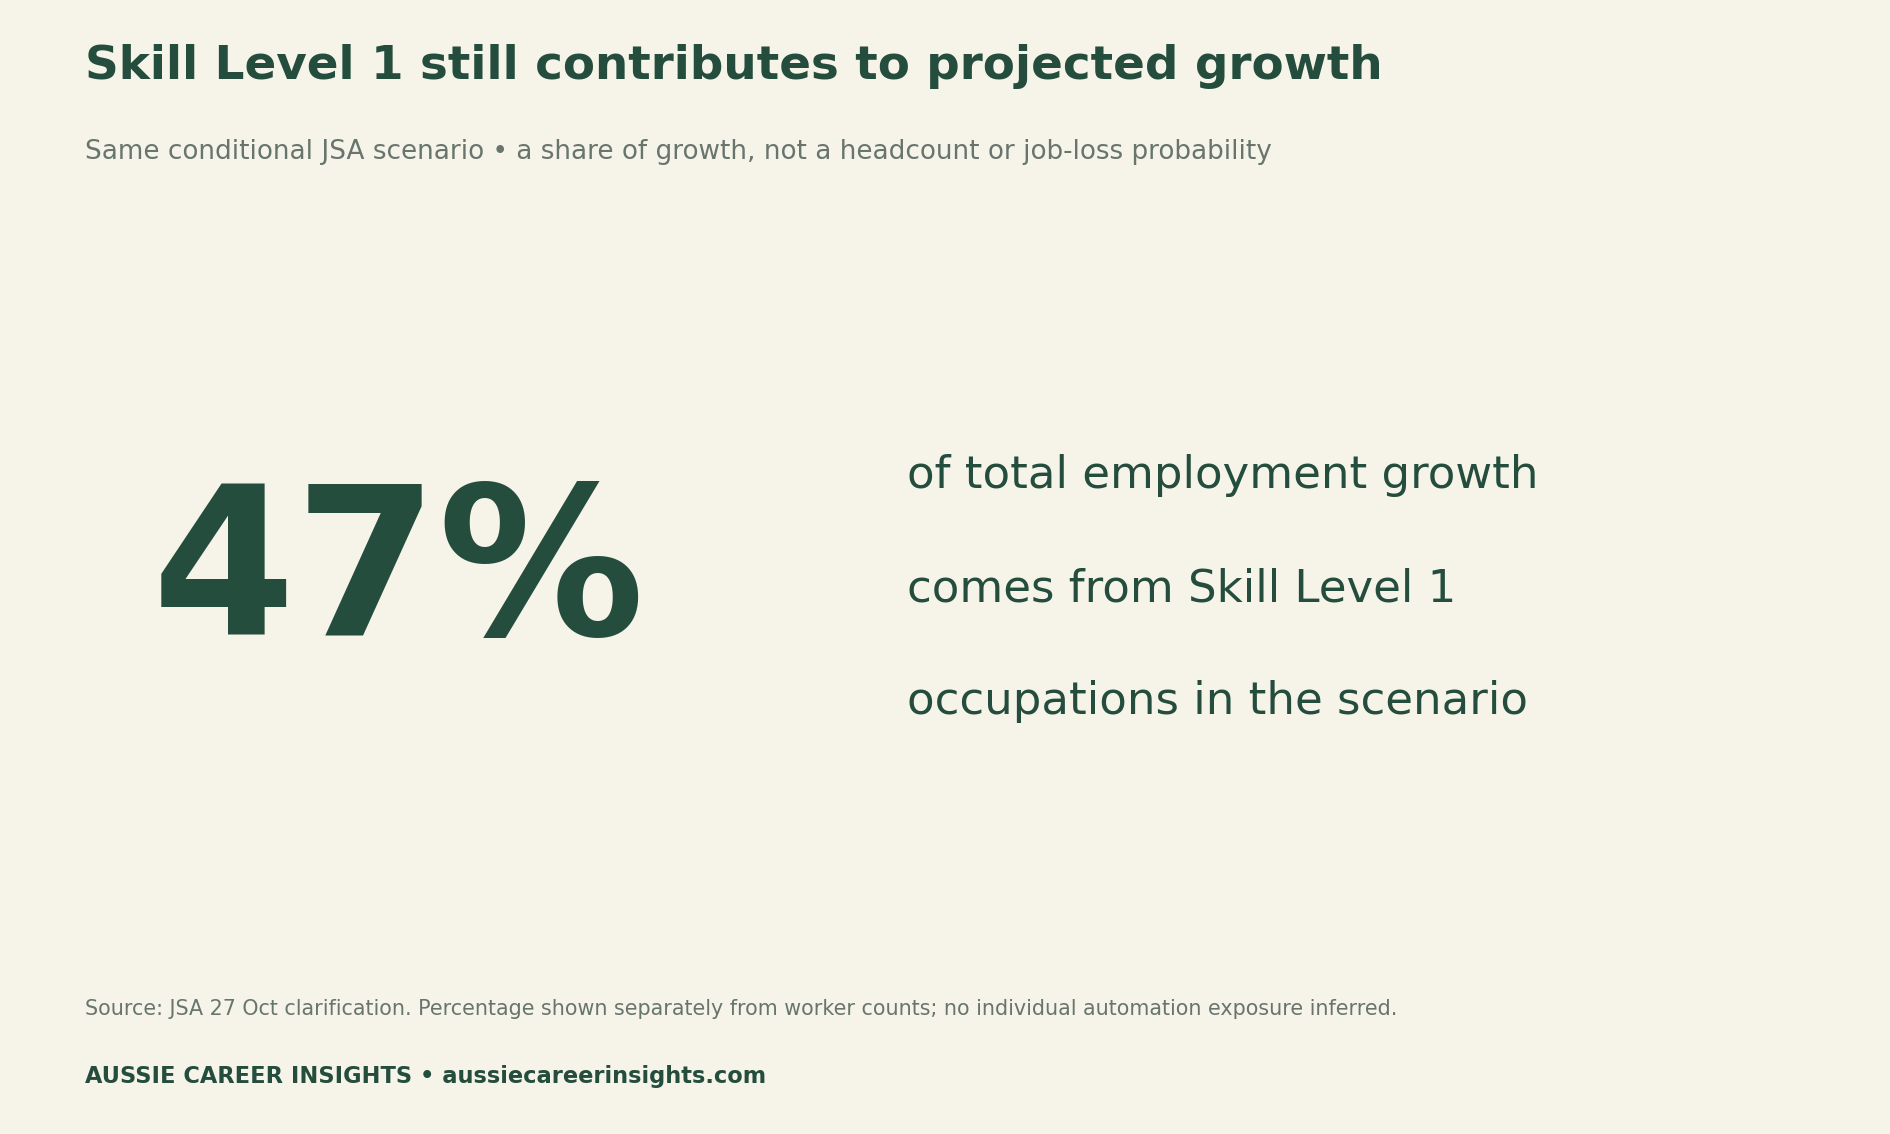
A headcount difference and a share of total growth describe different features of a scenario. Neither becomes a personal probability simply because it appears in an official publication. Always retain the denominator alongside a percentage, including which total it refers to.
Likewise, do not subtract the two headcount differences and call the result a national forecast. The supplied figures omit other skill groups. Without complete coverage and compatible definitions, that arithmetic would answer a question the evidence does not support.
How slower growth can coexist with growth
Consider a deliberately fictional index. A group starts at 100. The future baseline reaches 140, while an alternative scenario reaches 130. The scenario is 10 below the future baseline, yet 30 above its starting point. Both comparisons are true because the reference points differ.
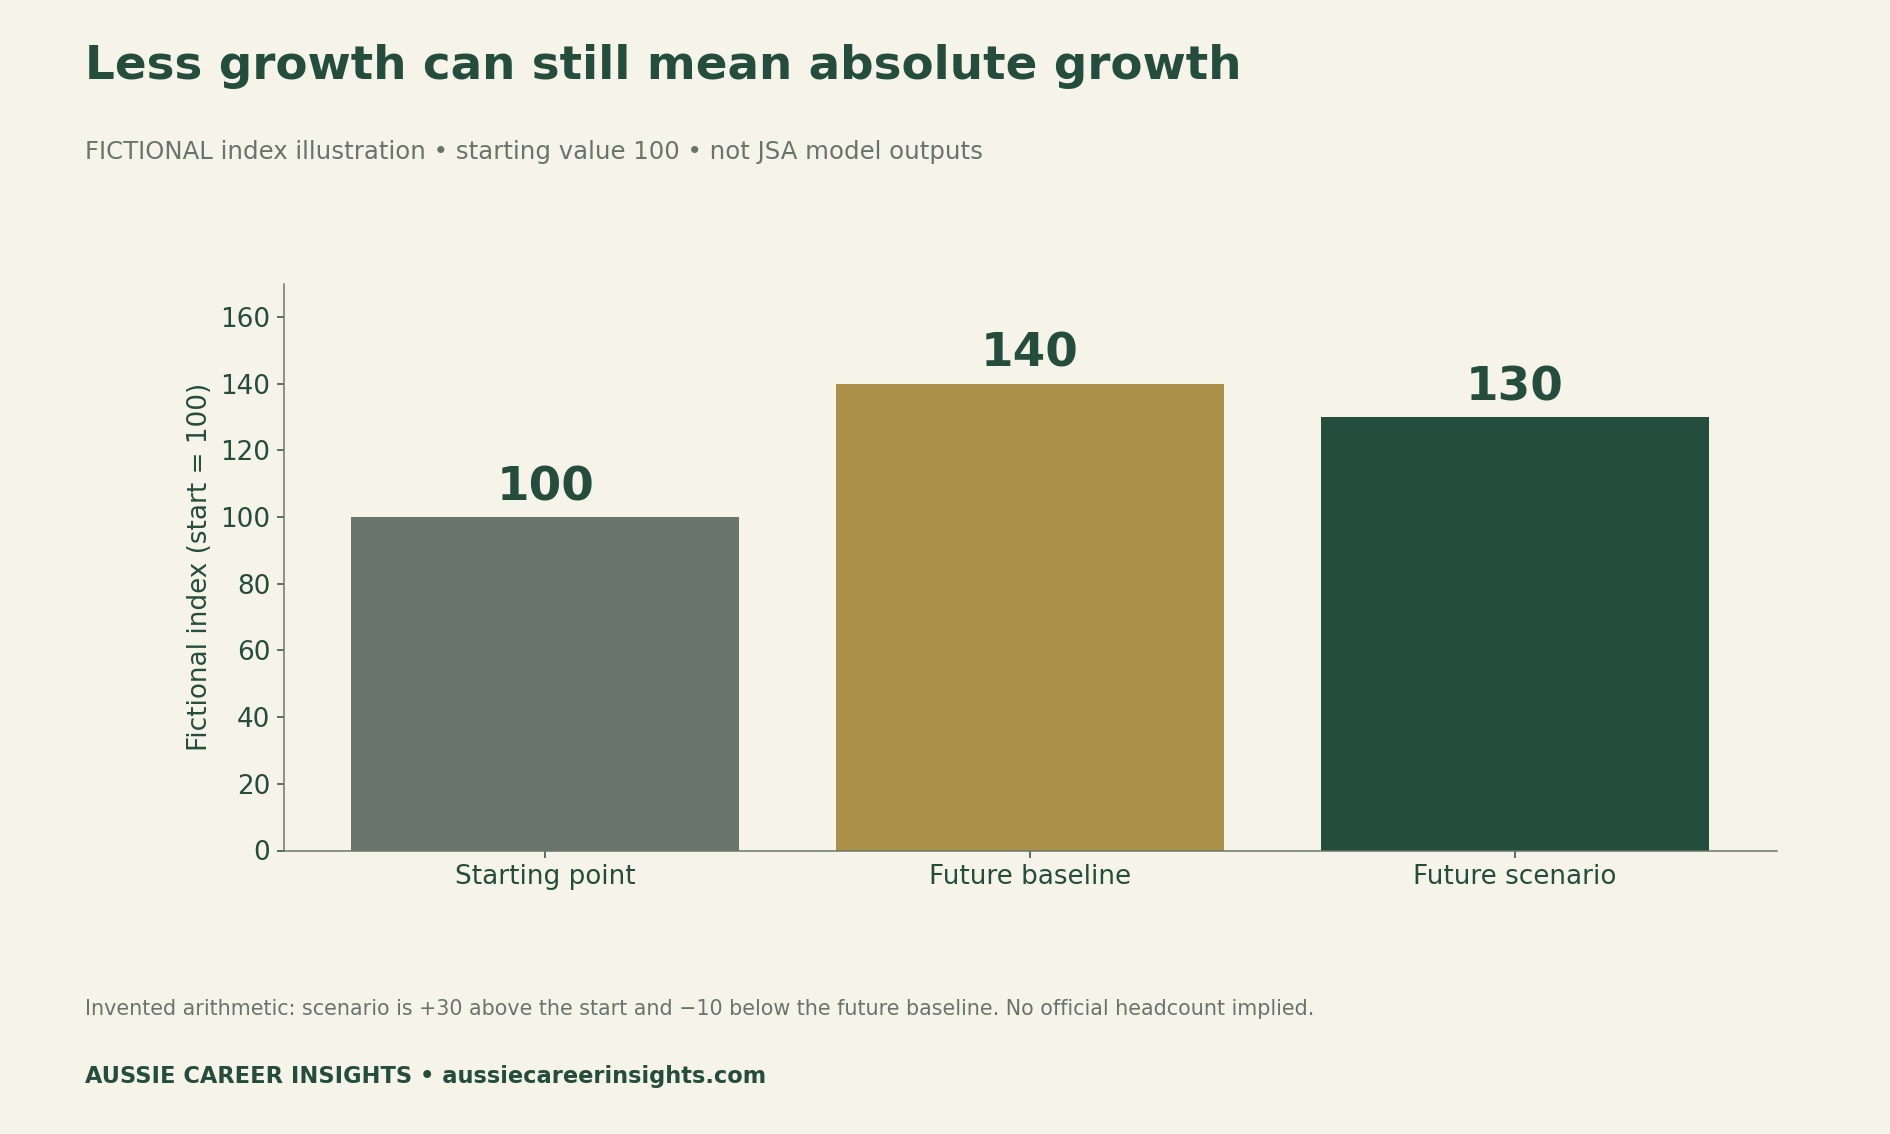
This example shows why a phrase such as fewer than baseline cannot automatically become fewer than today. However, the illustration does not reconstruct JSA’s full model. We do not infer its missing starting values, detailed occupational paths or uncertainty range from three numbers in a clarification.
Use five checks on an AI jobs claim
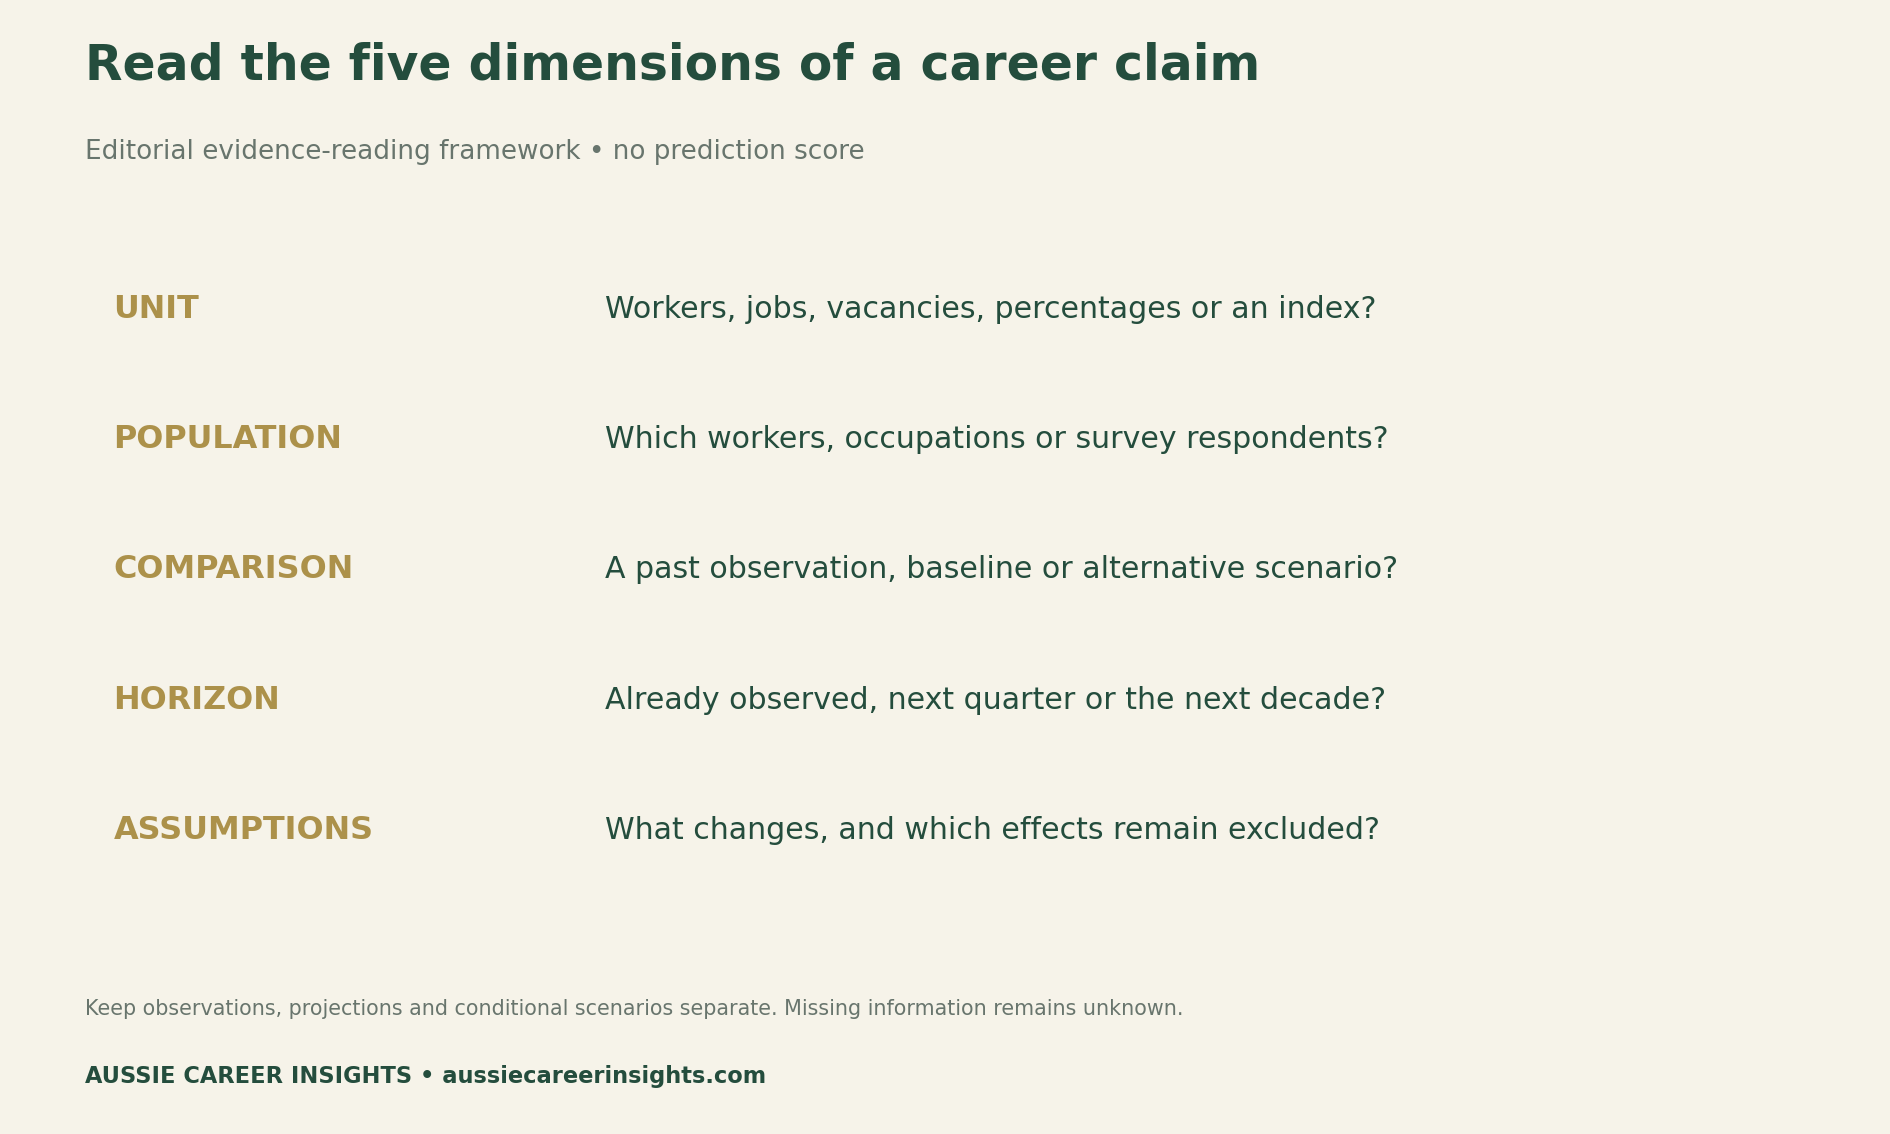
| Check | What to record | Why it matters |
|---|---|---|
| Unit | Workers, jobs, vacancies, percent or index | Different measures cannot be silently exchanged |
| Population | Skill group, occupation, region or survey sample | A broad group does not describe every role |
| Comparison | Baseline, prior period or alternative scenario | A relative shortfall can coexist with growth |
| Horizon | Observation dates and forecast endpoint | Future projections are not events already observed |
| Assumptions | Included changes and excluded effects | An excluded effect cannot explain the model result |
First save the original URL and publication date. Then write down the claim in your own words and match each part to the source. If the headline names AI but the model excludes AI, record that mismatch explicitly rather than relying on the headline’s tone.
Next, distinguish an observation from a forecast or conditional scenario. A measured historical job loss, a projection and an alternative-policy comparison need different interpretations. A correction may resolve one misleading reading while leaving other questions unanswered.

Connect the claim to the decision you face
For a training decision, identify the job tasks you want to perform and the skills a course actually teaches. Next, collect current role descriptions and entry requirements. A broad scenario difference does not tell you whether one course is recognised, affordable or relevant to those tasks.
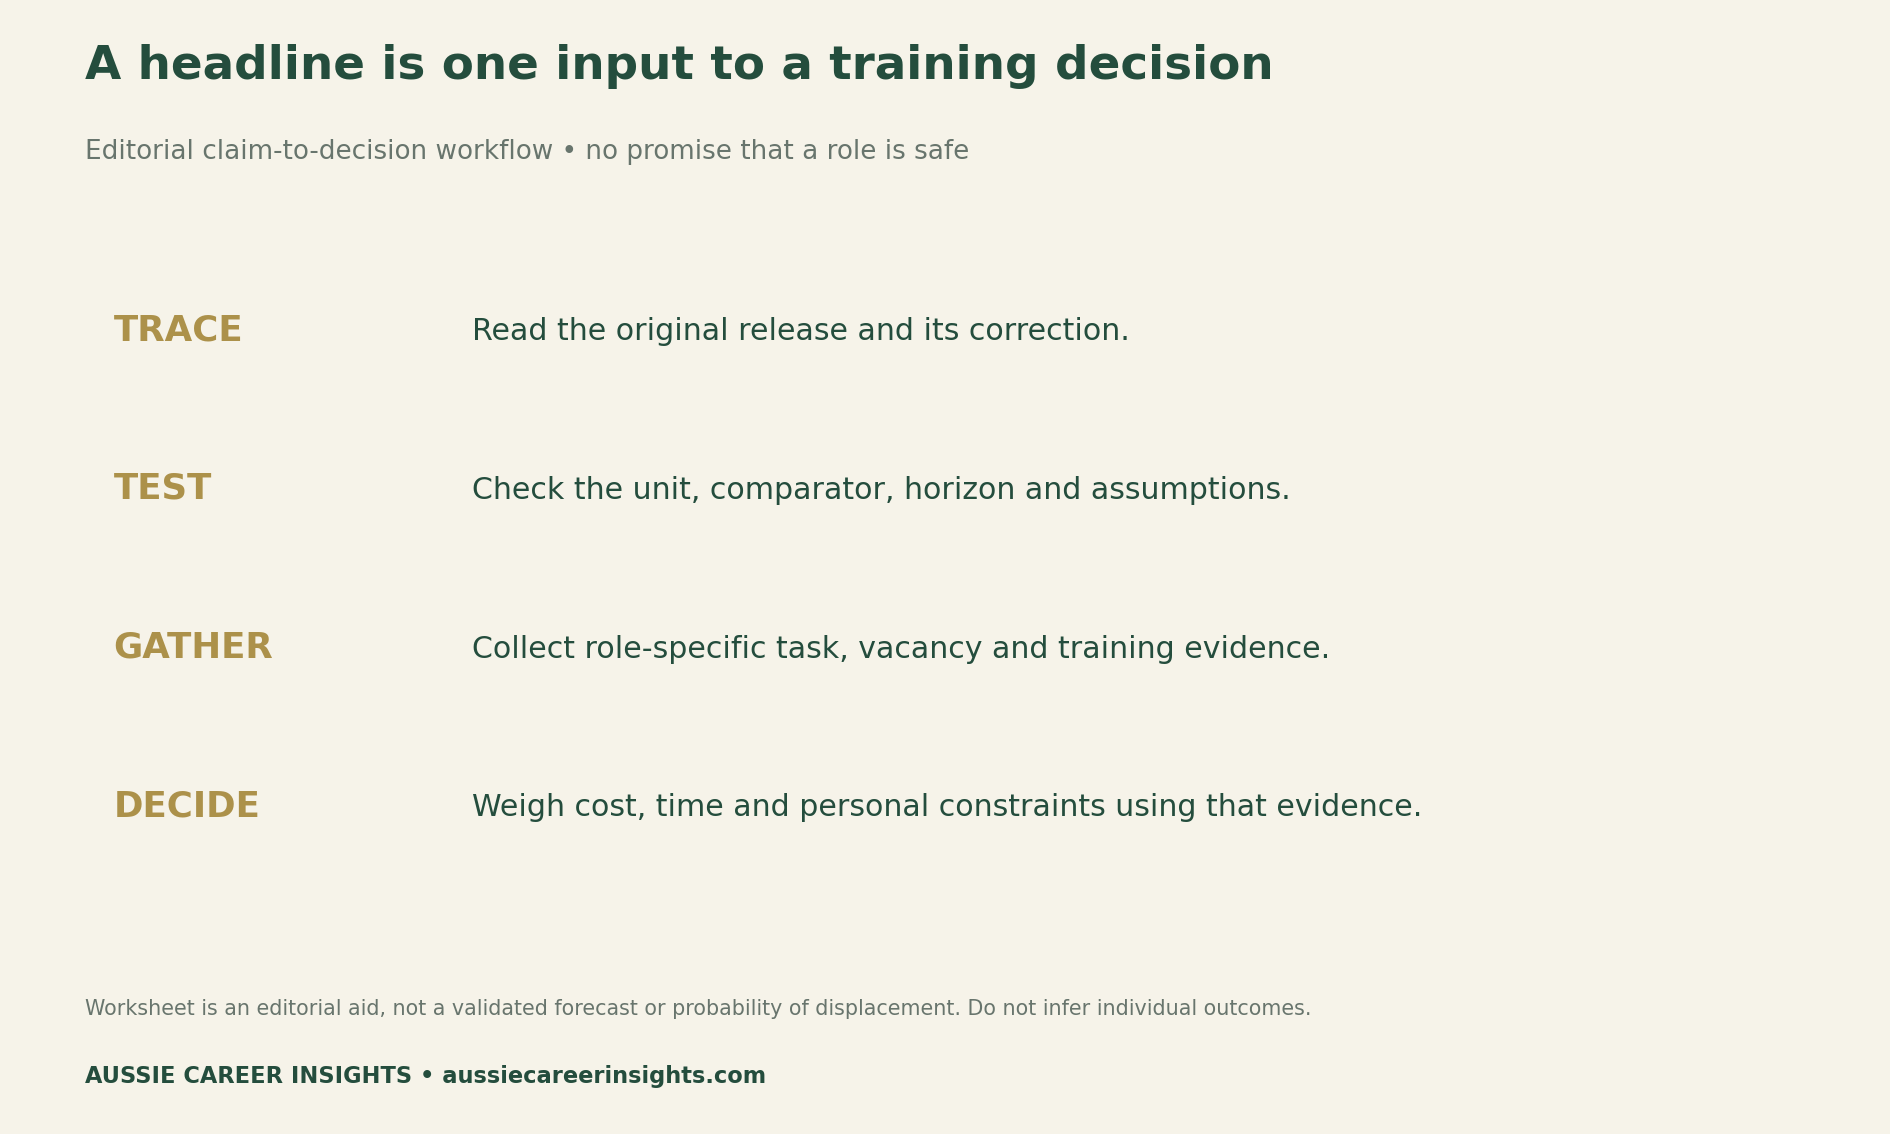
Also compare the time and total cost involved, including what you would give up while studying. Ask for evidence about assessment, practical work and the requirements of the roles you are targeting. Keep unsupported placement promises separate from verified information. No training provider was tested for this article.
For an existing role, examine the tasks rather than assuming an entire occupation changes in one way. Discuss actual workplace plans through appropriate channels and look for documented changes. However, do not publish confidential employer material or use a national headline to invent a displacement date for yourself or colleagues.
Your Personalized Career Strategy
Unlock your potential with tailored career consulting. Get clear, actionable steps designed for your success. Start now!
Get StartedDownload the evidence worksheets
JSA scenario-difference data (CSV) retains the two headcount differences, horizon, source and interpretation. The 47% share remains a separate figure with its own unit. No national net-job estimate is calculated from the partial headcounts.
Blank claim-check worksheet (CSV) records the original source, unit, population, comparator, assumptions and unknowns. It also asks what decision you are considering and what further evidence you need. It is a plain worksheet, not an automated prediction tool.
Fictional baseline illustration (CSV) preserves the 100, 140 and 130 index values. Use it to reproduce Figure 3 without confusing the example with official employment figures. The website does not collect completed worksheets or private employment records.
Read this alongside broader career background
Our guide to AI specialists and the future of work covers broader role context. This article has a narrower purpose: checking one numerical claim against its original clarification. It does not repeat a list of possible AI careers.
Our local job-market comparison guide provides another example of keeping data definitions and geography visible. A national scenario cannot replace evidence about a specific vacancy, employer or place. Combine sources only when their units and scope fit the decision.
Method, limitations and corrections
We checked JSA’s original clarification and retained a rendered source copy. We transcribed the two scenario differences and the separately stated growth share. Scripts generate the figures and data; official statements, fictional arithmetic and editorial frameworks carry distinct labels.
The fictional check confirms that 130 minus 100 is positive 30, while 130 minus 140 is negative 10. No model reconstruction, occupation-level probability, salary forecast or displacement timetable follows from it. We do not combine the two partial skill groups into a national total.
This correction concerns the meaning of a particular scenario. It cannot determine individual exposure or resolve the wider AI employment debate. The worksheet has not been validated as a prediction model or tested for reader outcomes. Corrections log: original source, chart units and fictional arithmetic checked on 30 October 2026.
Suggested citation: Aussie Career Insights, “AI Job Losses in Australia: What the 139,000 Figure Actually Means,” 30 October 2026. Cite JSA for the official scenario statements; identify the index illustration and worksheets as our educational material.


