




Applied research jobs Australia searches often reward a polished prototype portfolio. A more useful work sample can show the decision behind the prototype: what you tested, which rule you set, what failed and what another team should test next. A faster result is not enough when a quality condition fails.
The 20 November 2026 CRC Projects announcement provides the context: A$81 million across 30 industry-led collaborations, including a A$20 million AI priority earmark. Those are funding figures, not vacancies or completed research results. This report uses a separate fictional bench example to build a reproducible decision memo.
Read a project award before treating it as a career signal
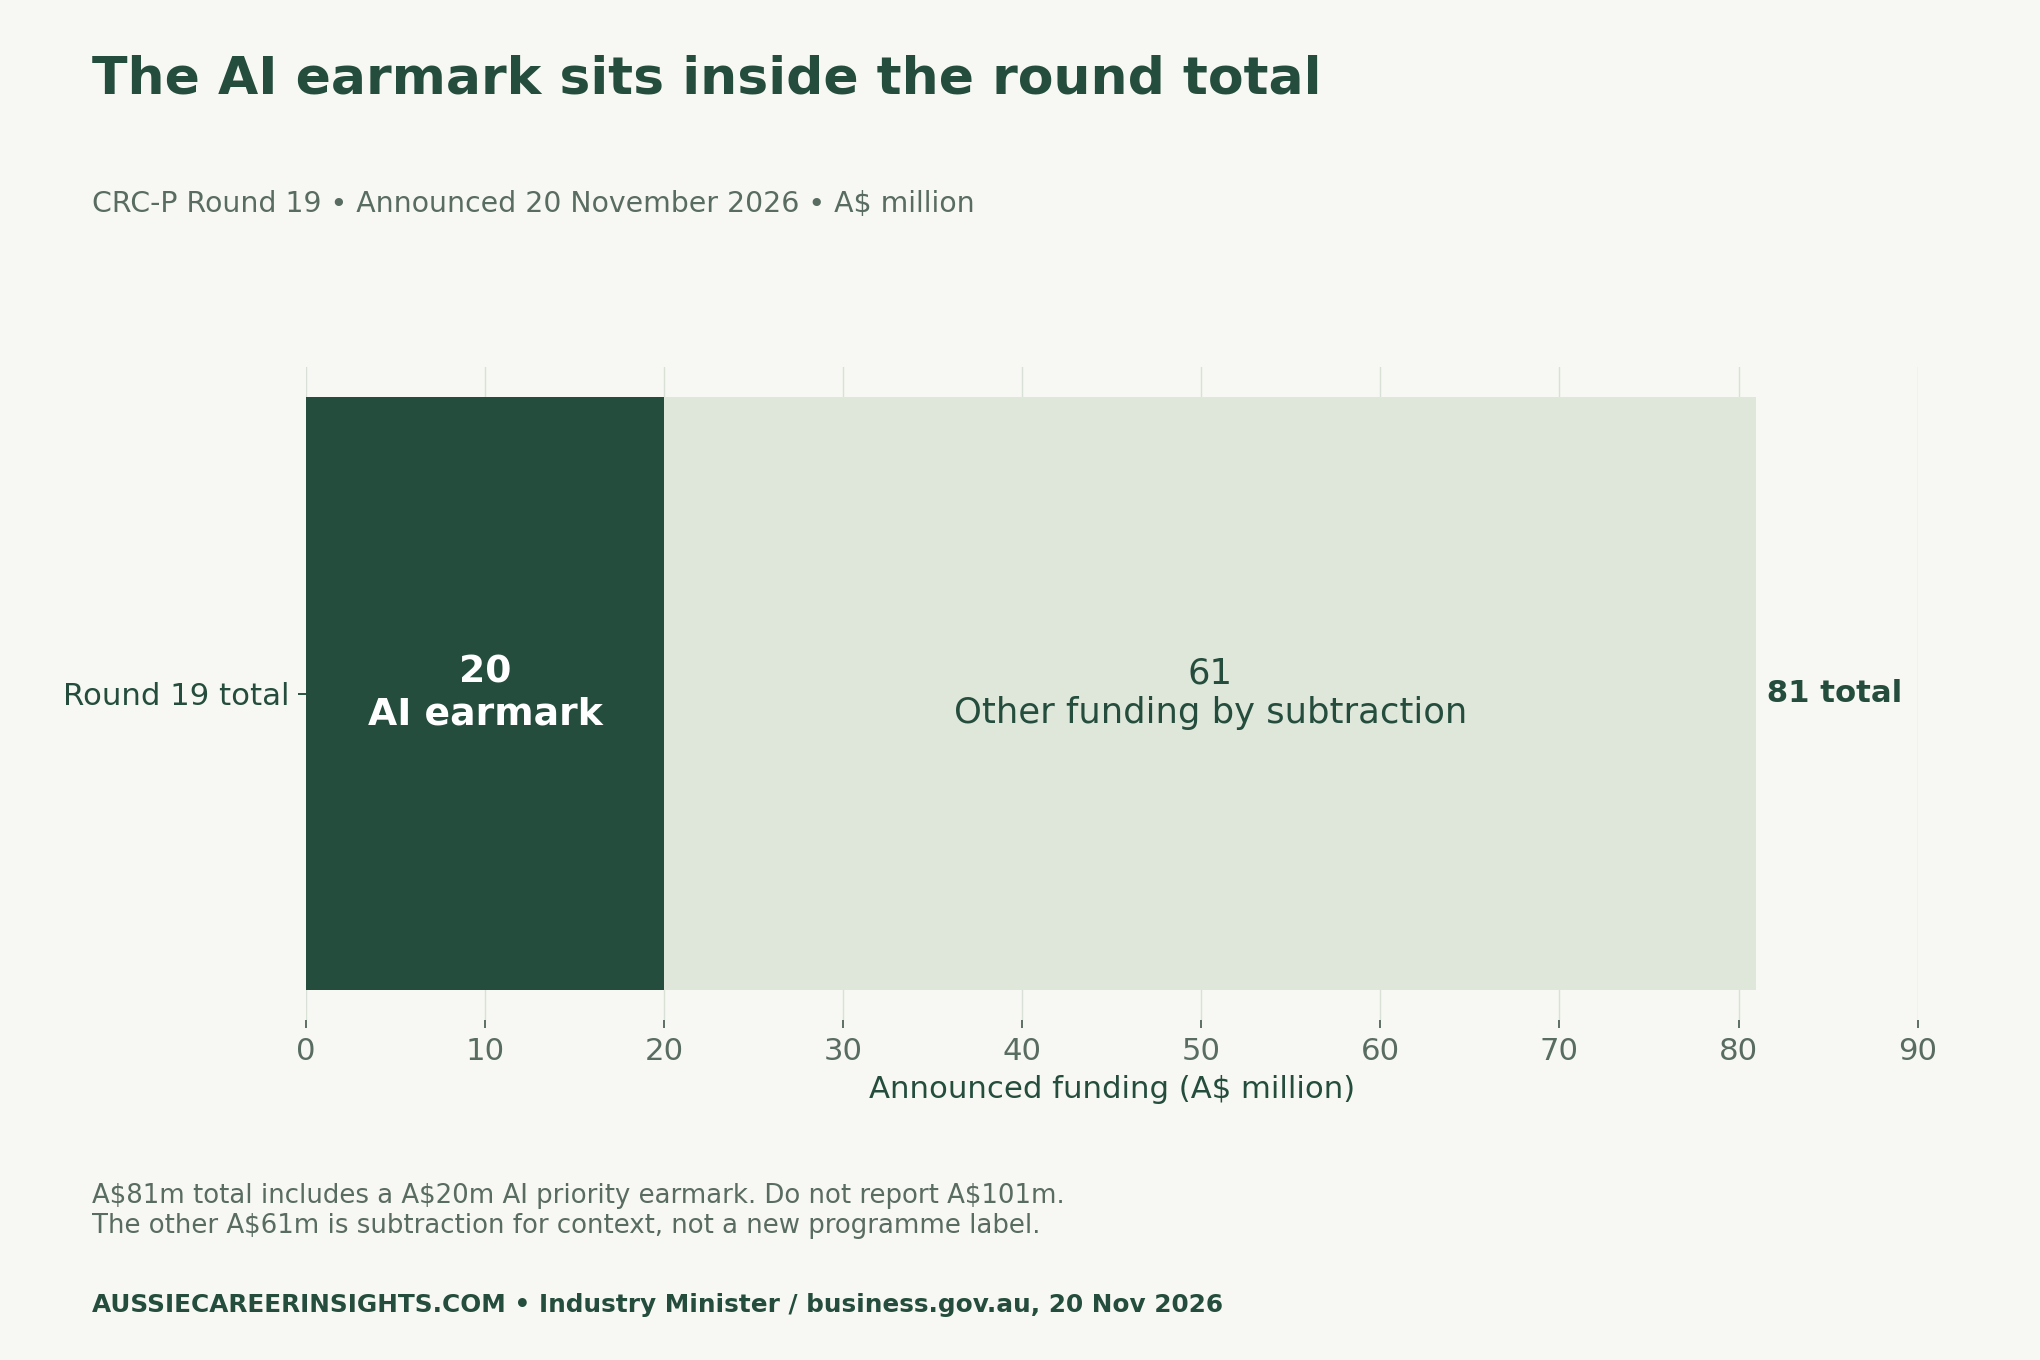
The official CRC-P programme page describes short-term, industry-led research collaboration. Its round outcomes table identifies the supported projects. An award can help you understand a technical problem; it does not establish that a team is recruiting or that its proposed solution already works.
For example, the announcement describes proposed space-weather sensing and mine-waste building-material work. The detailed table lists A$2,975,000 for Saber Astronautics and A$3,000,000 for Zest Image. The minister’s release rounds the former to A$3 million. Keep that precision difference visible rather than silently mixing exact and rounded values.
If a real posting interests you, read its stated duties and selection criteria. Then choose a public, low-stakes demonstration relevant to the decision it describes. Do not copy client records, confidential code or unpublished laboratory results into an application.
Applied research jobs Australia: start with a decision
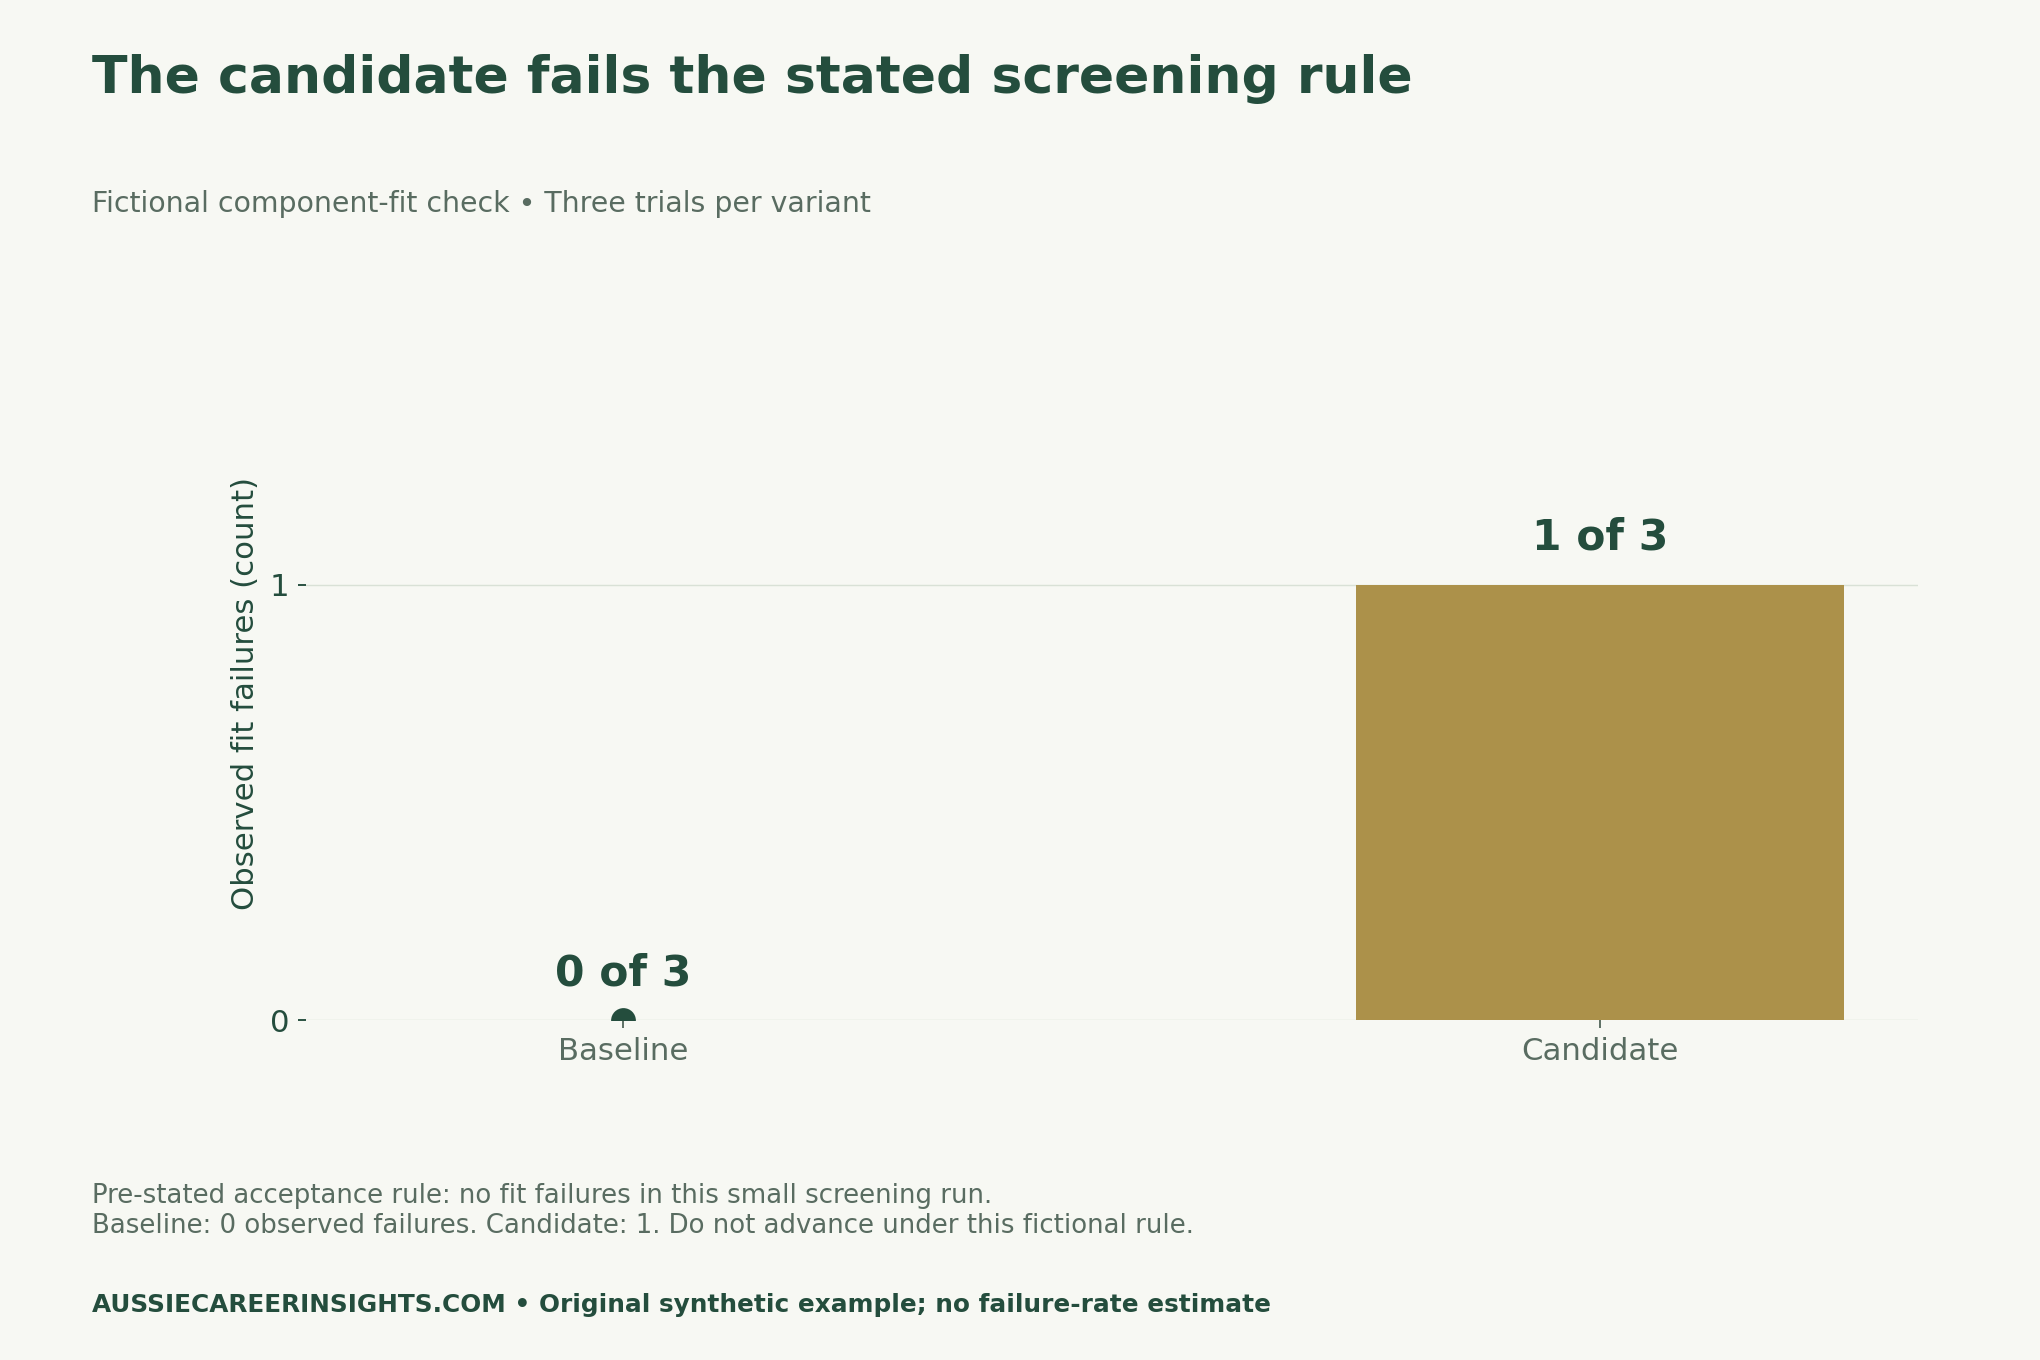
Our invented task asks whether a candidate component should progress beyond a small fit-screening run. Before viewing results, the memo sets a simple acceptance rule: no fit failures in this screening run. Setup time is a second measure, not permission to ignore the rule.
This is an editorial teaching example unrelated to the actual grantees. It is not a materials test, fire assessment, certification, field trial or claim about an employer’s standards. The small dataset is deliberately simple enough for a reader to reproduce every calculation.
| Variant | Setup times, minutes | Fit failures observed | Decision boundary |
|---|---|---|---|
| Baseline | 8, 7, 9 | 0 in 3 trials | Three invented observations only |
| Candidate | 6, 7, 5 | 1 in 3 trials | Fails the pre-stated no-failure screen |
Publish the time calculation without hiding the failure
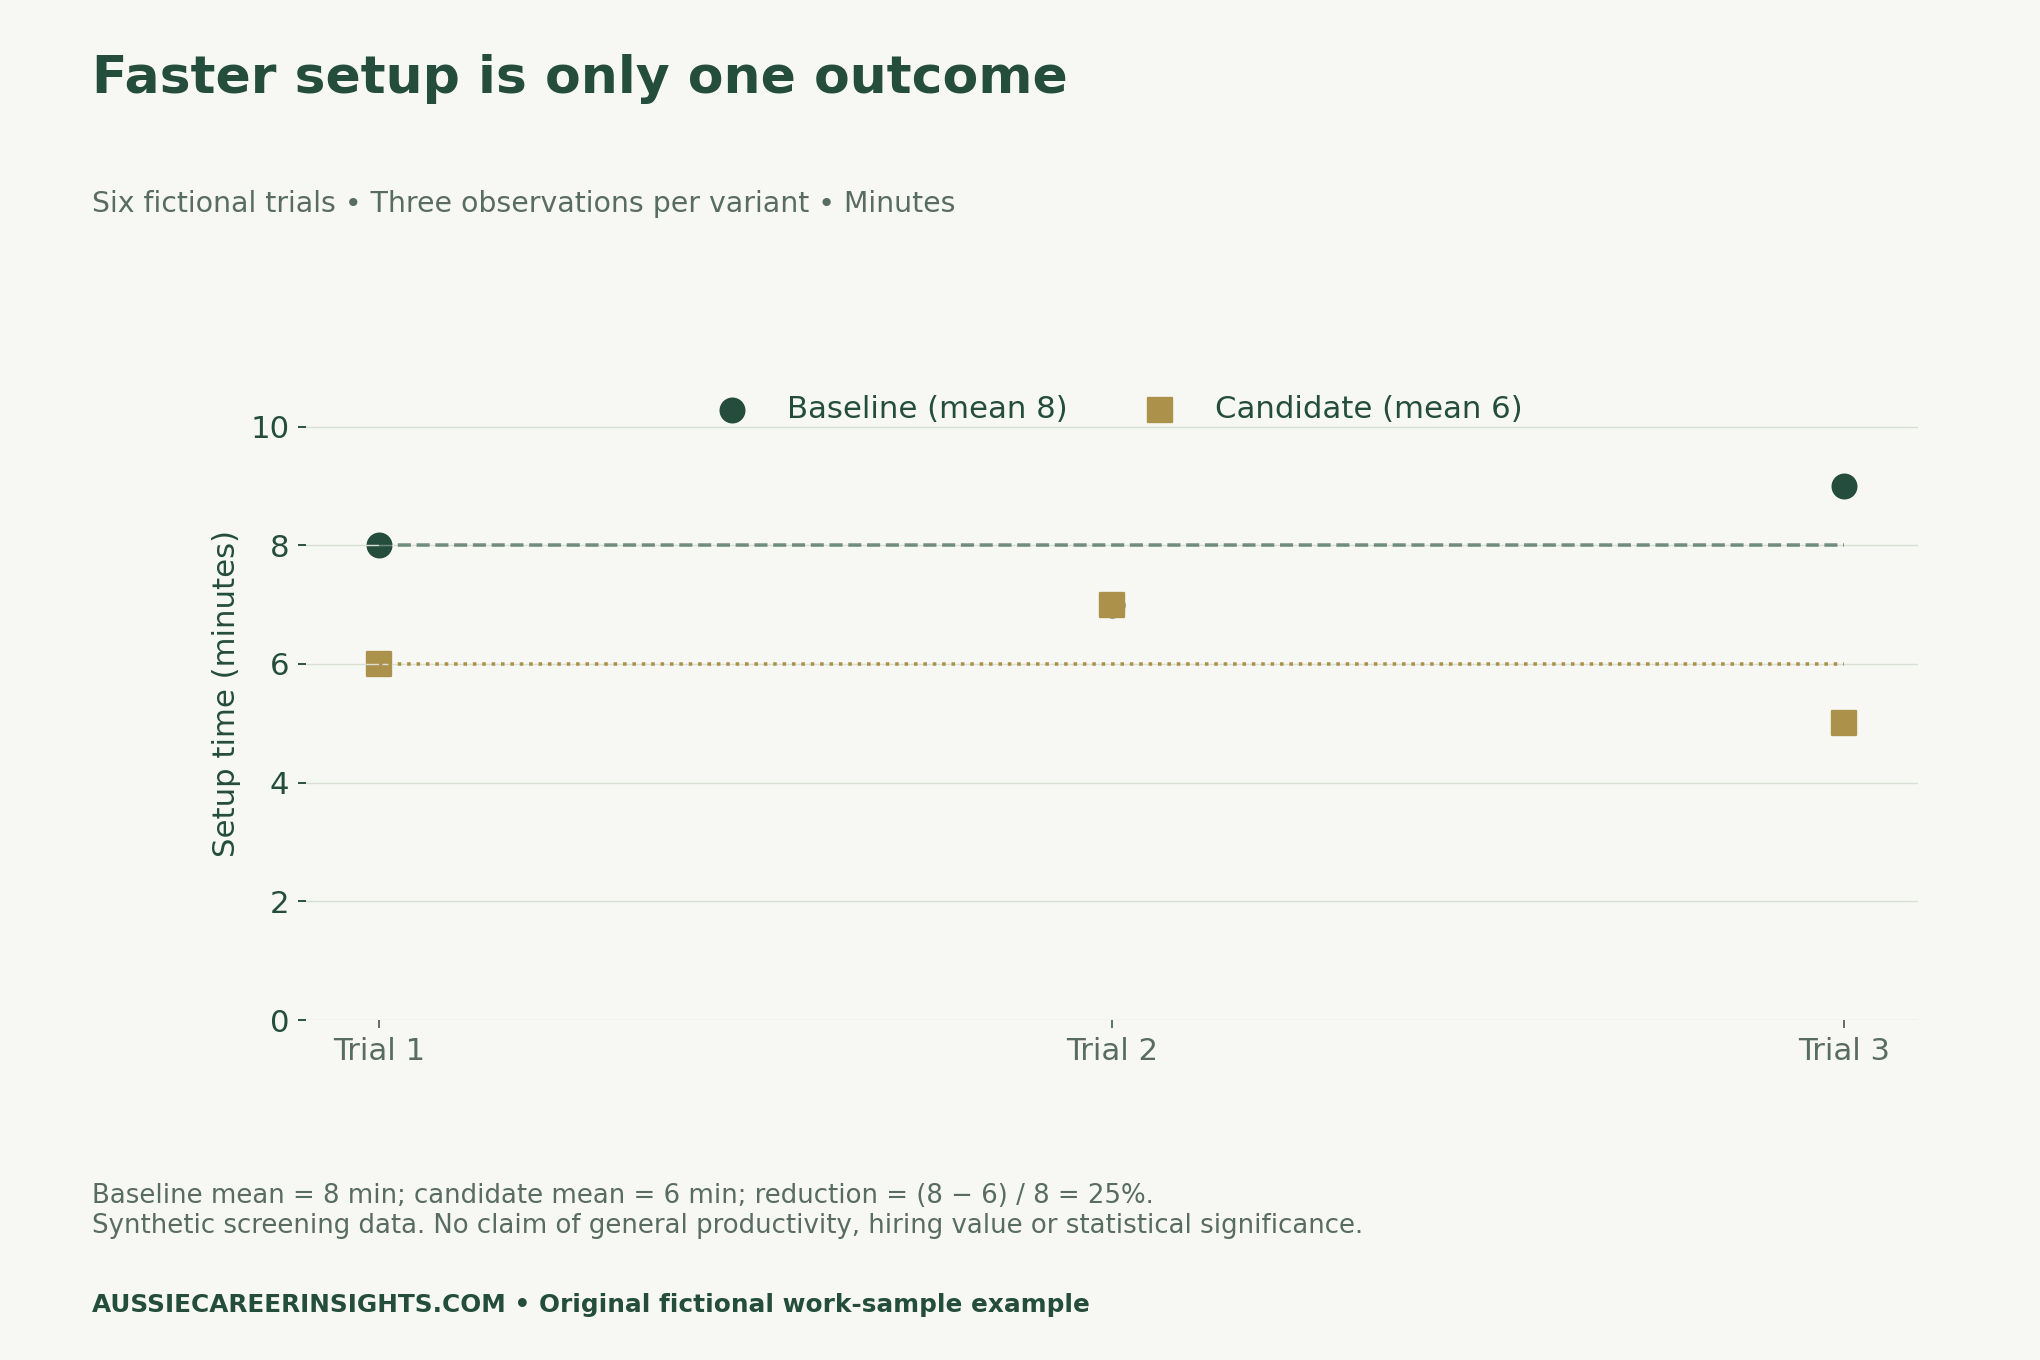
The baseline total is 24 minutes across three trials, so its mean is 24 ÷ 3 = 8. The candidate total is 18 minutes, giving 18 ÷ 3 = 6. Relative reduction is (8 − 6) ÷ 8 = 0.25, or 25%. The difference in the two means is 2 minutes.
In a spreadsheet, filter each variant and use AVERAGE on its setup-minute cells. For these CSV rows, a simple sheet can use =AVERAGE(D2:D4) and =AVERAGE(D5:D7). Calculate =(baseline_mean-candidate_mean)/baseline_mean in a separate cell. Keep the denominator named so someone else can check the claim.
However, the candidate has one recorded fit failure. Keep that row in the dataset and explain its anomaly. Dropping it because the speed result looks attractive would change the question and conceal evidence the receiving team needs.
Make the handoff decision explicit
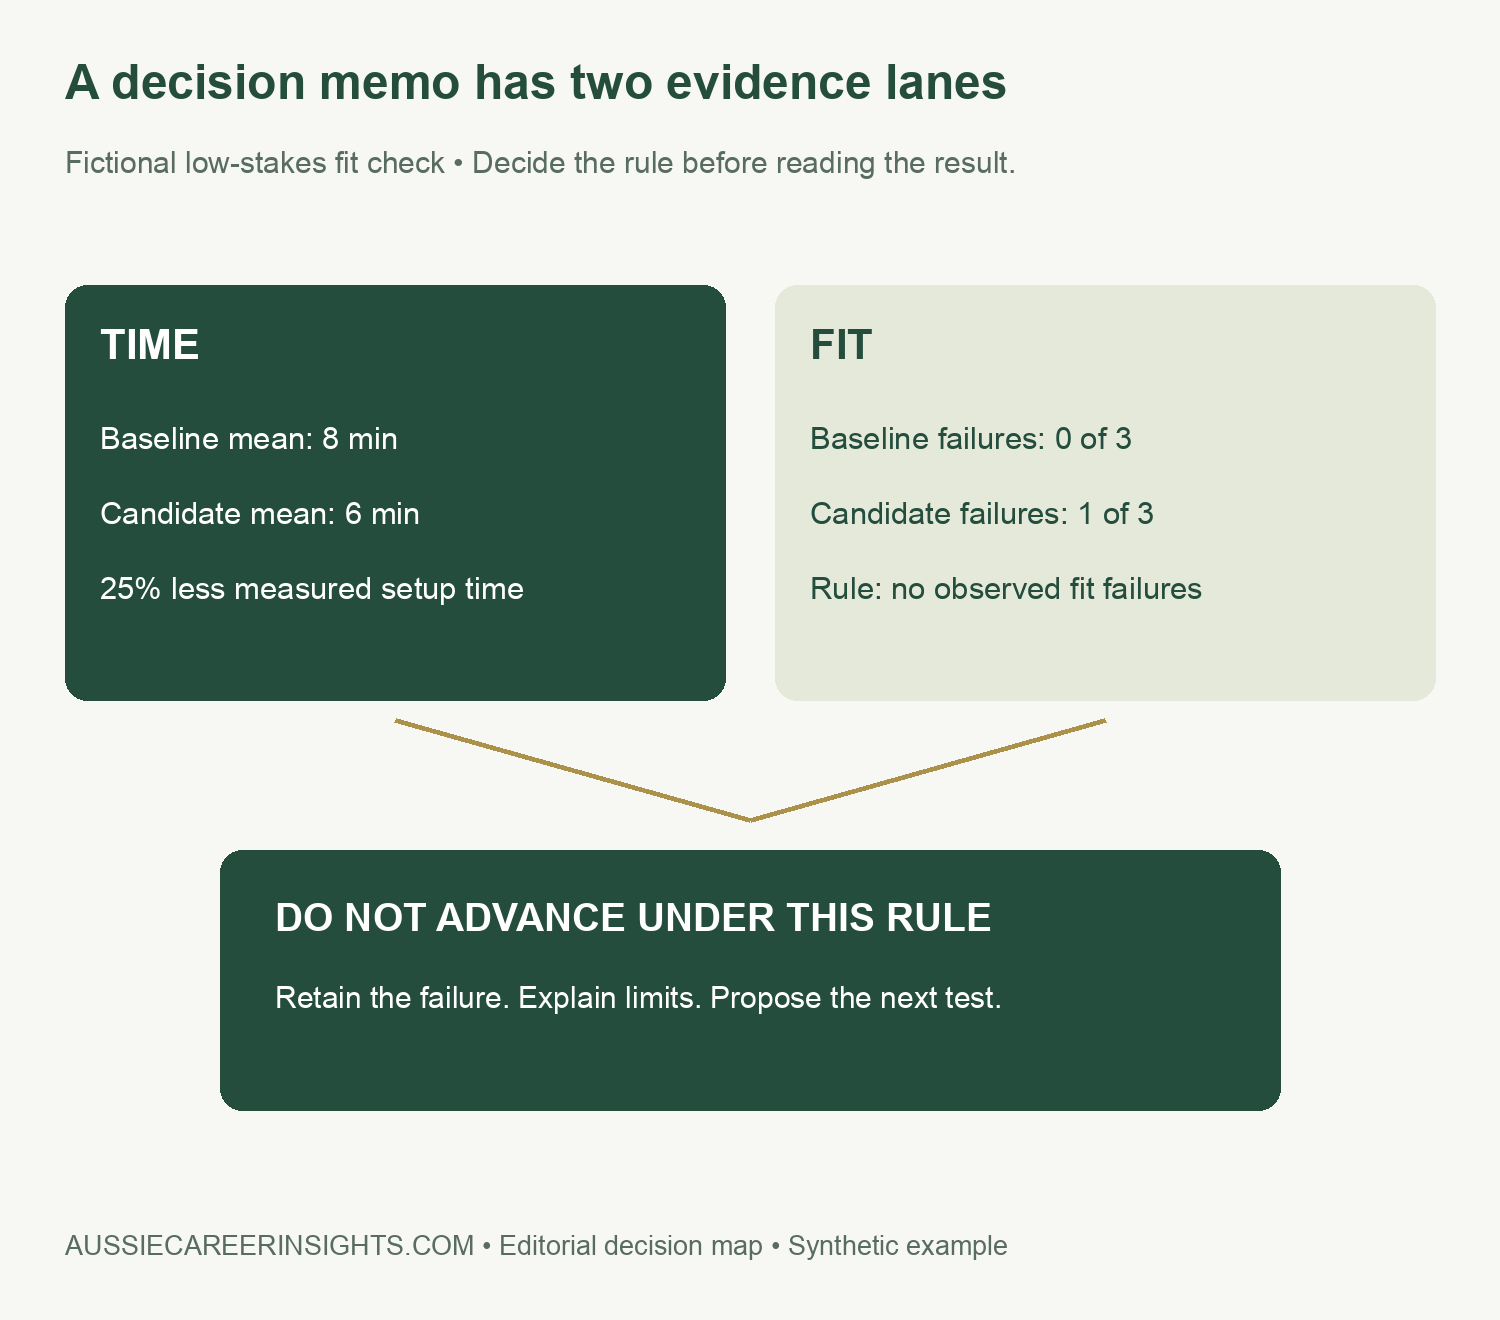
The memo’s conclusion is to withhold advancement under this particular rule. That is narrower than saying the design can never work. A useful next-test proposal would investigate the failed fit condition and specify what evidence could resolve it. Do not rewrite the criterion after seeing the result just to obtain a pass.
The receiving partner should be able to see the question, conditions, observations, calculations, limitations and next decision in one place. State what you personally did in a real work sample. If a task was shared, separate your contribution from the team’s work.
What belongs on the one-page work-sample memo?
Begin with the decision needed and the criterion set beforehand. Add a small table of observations, both outcome measures and the reproducible calculation. Then describe anomalies and limits before making a bounded recommendation. End with a specific next test or a question for the receiving partner.
Do not overstate six synthetic rows as a robust experiment. This example has no randomisation, representative sampling, uncertainty estimate or independent replication. A real research task may require those features and specialist methods. The worksheet helps organise evidence; it does not replace them.
For comparison, our WA apprenticeship route guide uses official contract evidence to answer an eligibility question. Here the purpose is different: showing how observations support a prototype decision, including a decision not to advance.
Your Personalized Career Strategy
Unlock your potential with tailored career consulting. Get clear, actionable steps designed for your success. Start now!
Get StartedMethod, boundaries and downloadable evidence
We checked the announcement against the programme page and round outcomes table on 22 November 2026. The funding chart nests the earmark within the round total. The other charts use only our invented component-fit data, with three observations for each variant and no inference to a wider population.
The trial CSV preserves the failed row. The calculation file names each formula and rule. A blank memo gives you room for a lawful, non-confidential example, while the context guide keeps official funding separate from synthetic observations. These tools make a work sample easier to inspect; they do not predict job success.
- Six fictional trial observations (CSV)
- Calculation and screening-decision guide (CSV)
- Blank work-sample decision memo (CSV)
- Funding context and field definitions (CSV)
Sources: Industry Minister, 20 November 2026; CRC-P programme; Round 19 outcomes. Suggested citation: Aussie Career Insights, “Applied Research Jobs in Australia: Show Your Test Evidence”, 22 November 2026. Original charts and worksheets distinguish official context from fictional teaching inputs.


