







A water data analyst portfolio can show how you handle definitions, provenance and missing information. Australia’s latest Water Account offers a useful public-data exercise: explain why water use fell while water consumption was almost unchanged. A clear answer requires more than an attractive chart.
This guide provides a four-panel chart, a comparison infographic and four CSV files for building a small, reproducible work sample. It uses the 2024–25 reference period from the release published on 12 November 2026. Research was checked on 14 November. The project is an original learning exercise, not a guarantee of employment.
Choose a focused water data analyst portfolio question
Start with a reader and a decision. For example, imagine a manager asking whether a headline fall in water use means every measure of demand fell. Your work sample should answer that narrow question, define the measures and show where the data cannot support a stronger conclusion.
Avoid beginning with a dashboard full of unrelated indicators. Write a short project statement first: who will read it, what they need to understand and which public measures are relevant. This makes later choices about units, charts and limitations easier to explain in a portfolio interview.
What the new ABS Water Account reports
The ABS Water Account, Australia, 2024–25 reports water use of 76,957 GL, down 2.2%; consumption of 17,163 GL, up 0.1%; reuse water supplied of 323 GL, up 5.5%; and desalinated water supplied by utilities of 199 GL, up 16%. These are four different measures, not four parts of one total.
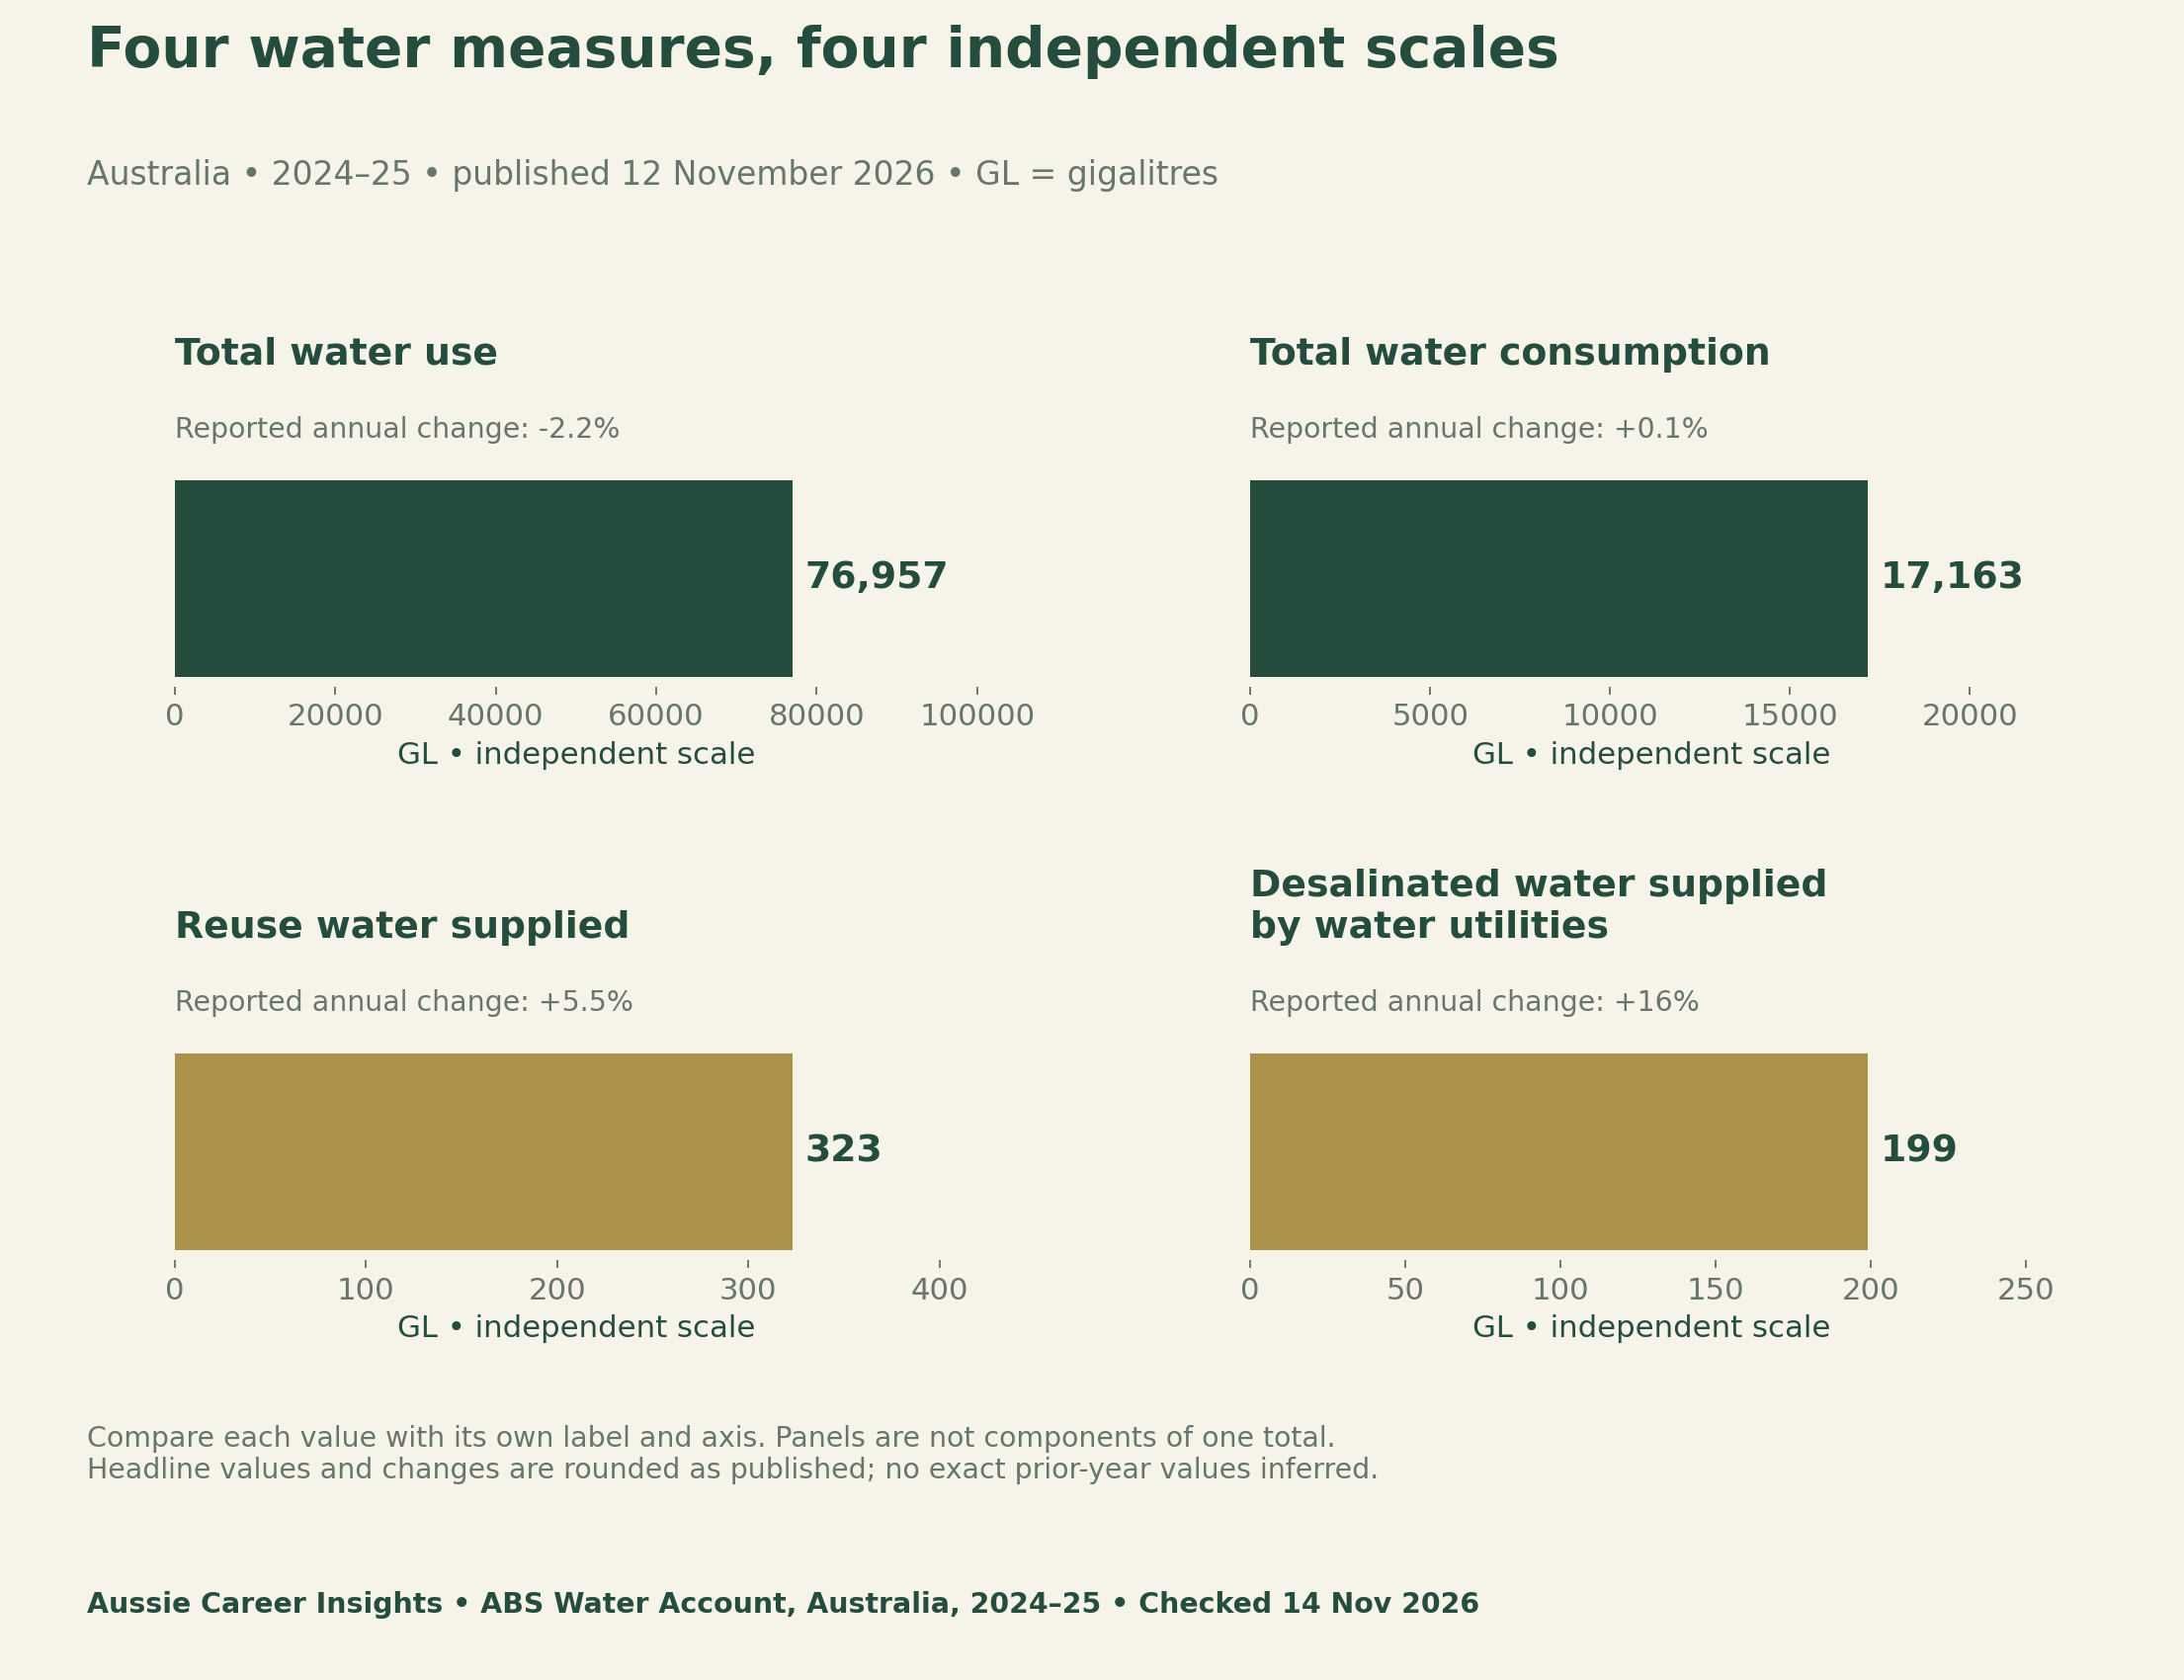
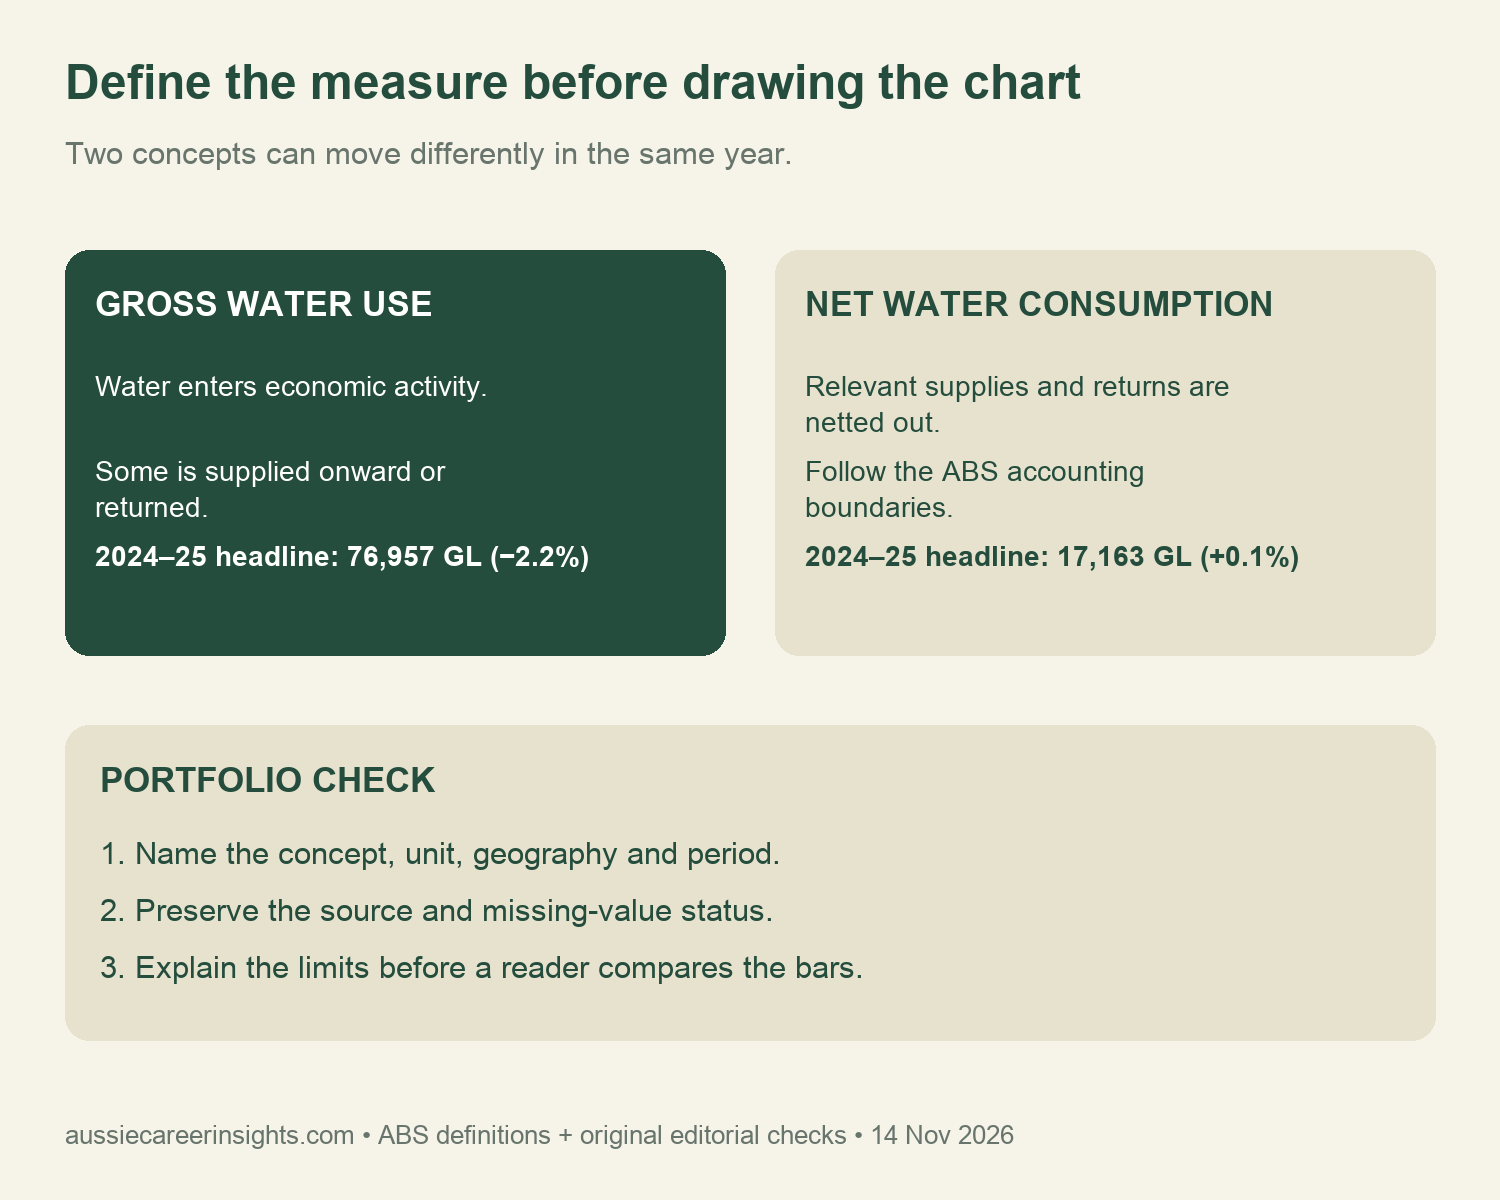
The same release explains that hydroelectricity uses large volumes and returns most to the environment. This helps explain the gap between gross use and consumption. The ABS methodology defines consumption after relevant supplies and return flows are netted out. Do not treat a fall in gross use as a measured fall in every net-use category.
Keep definitions visible in the water data analyst portfolio
For your project, give each measure a plain-language definition and retain the official source. Include the unit beside the value. A number labelled only water creates unnecessary ambiguity. Also record the geography and reference period, because the publication date describes when information became available rather than when the water activity happened.
The four chart panels deliberately keep separate axes. Read the numbers and labels within each panel. If your next version uses a shared scale, state that choice and check whether smaller quantities remain legible. Do not solve a layout problem by creating a percentage composition from overlapping water measures.
Build a source schema that another reader can follow
Save a dated source record before transforming values. The supplied provenance CSV records the measure, published volume, unit, reported annual change, geography, period, release date, extraction date and exact source section. It is a selected transcription of the release’s key statistics, not the full set of ABS data cubes.
For a larger version, obtain the original tables from the release’s Data downloads section and keep the downloaded source separate from your prepared analysis. Record the workbook sheet, row and column used. Never imply that a full workbook reconciliation occurred when you extracted only the web release’s key indicators.
| Project field | What it preserves | A useful check |
|---|---|---|
| Measure and definition | The actual concept being analysed | Could this label be confused with another measure? |
| Unit and precision | Published GL values and rounded changes | Were ML, GL and kL kept distinct? |
| Geography and period | Australia, 2024–25 reference year | Did the release date accidentally replace the data period? |
| Source and transformation | A reproducible path from source to figure | Can another reader rebuild the selected chart? |
| Missing-value rule | The reason a value is unavailable | Has a missing estimate silently become zero? |
Keep unavailable agricultural estimates out of zero bars
The methodology describes an interim agricultural irrigation approach for 2024–25. Agricultural estimates for the Northern Territory and Australian Capital Territory are unavailable, and the agricultural surface-water/groundwater split is not published. Method changes also require caution when comparing across affected years. Missing values do not establish that no water was used.
In your own file, retain an explicit status such as unavailable and keep its reason in a separate note. A chart can omit the unavailable observation while clearly describing the omission. Do not enter zero solely to make a plotting tool accept the row, and do not rank an omitted jurisdiction as the lowest user.
The supplied quality register gives these issues a place in the project. Add the action you took and the affected output. This shows how you handled a limitation rather than hiding it in a generic disclaimer. If you change the scope later, revisit the register before reusing a previous chart.
Write a manager-facing findings note
A useful note answers the opening question in a few sentences. Identify the measure that changed, the relevant period and the definition that controls interpretation. Then explain the practical limit. Do not infer efficiency, policy success or a causal employment trend from these four headline indicators alone.
Keep source facts separate from your analytical choices. For example, selecting four indicators is your project design. The published values are source facts. A claim about why a particular business changed its water demand would need additional evidence. A careful portfolio makes these boundaries easy to see without overwhelming its reader.
Your Personalized Career Strategy
Unlock your potential with tailored career consulting. Get clear, actionable steps designed for your success. Start now!
Get StartedShow the analytical skills your work sample demonstrates
A reviewer can learn from your question selection, field definitions, unit handling, source records, chart design and explanation of uncertainty. Use your README to explain those decisions. Avoid presenting the project as proof of specialist field experience or proficiency with a tool you did not actually use.
Our task-to-evidence guide shows how a work example can support a specific skill claim. The occupation-specific research guide explains why published statistics and current employment opportunities need different evidence. Neither this portfolio nor a dataset guarantees a role.
Download the water data analyst portfolio files
Use the provenance table for the four published indicators, the dictionary for concepts and the quality register for limitations. Complete the blank README plan for your own question and intended reader. These are CSV planning files; they do not contain an automated dashboard or a complete copy of the ABS workbooks.
- Four key indicators with dates, units and provenance (CSV)
- Water measure dictionary (CSV)
- Data-quality and missing-value register (CSV)
- Blank portfolio README and methods plan (CSV)
Methods, limits and how to reproduce the example
We transcribed the four rounded headline indicators from the live ABS release and checked its methodology. Plot each volume in its own zero-based panel, retain the reported change as a label, and carry the source and period into the caption. Do not back-calculate exact earlier values from rounded percentages. No time-series model, causal estimate or industry reconciliation was produced.
The sample’s contribution is a reproducible documentation method and a careful explanation of different concepts. It does not validate the full Water Account, audit a workplace or assess a candidate. Recheck the release for corrections before extending the exercise. Record any update so that your portfolio remains tied to the version you actually used.
Suggested citation: Aussie Career Insights (14 November 2026), “Water Data Analyst Portfolio: Use Australia’s New Water Account Correctly”, selected ABS key-statistics analysis and original portfolio documentation tools. Cite the ABS release separately when reusing its indicators.


